What Are Liquidity Pools in Forex
Understanding and identifying liquidity pools in forex is key if you want to become a better trader, but what are liquidity pools?


Say you’re picking a bottom on EURUSD. You know you shouldn’t be, but the trend is up and it looks like a great trade with a solid reward profile.
You put your stop right below the range low, keeping it tight to squeeze out every last bit out the setup.
You get stopped out.
By 1 pip.
Price bounces.
Price moves higher, hits your original target and there you are on the sidelines feeling like a fool.
Sound familiar? Of course it does because this happens to everyone.
But why?
What are forex liquidity pools?
Liquidity pools occur around key support and resistance, or areas on the chart where a lot of trading activity takes place.
If you trade size, you need this trading activity to get your order filled.
Most retail traders don’t have to worry about liquidity when it comes to getting filled. In fact, even some professional swing or trend traders may not have to worry about it.
The forex market is extremely liquid and there’s more than enough liquidity to go around for us small fish in the retail trading scene.
Now let’s imagine a hedge fund manager, Bob, looking to get a 2 billion dollar order on AUDUSD filled – that’s 20 000 lots.
Yes, the forex market is the most liquid market in the world, but no market is that liquid at every price point, 24 hours a day.
If Bob wants to get his order filled at a good price, he’s going to need to play this carefully.
If he just throws this trade on at market, he’ll get filled alright but at a terrible price.
If he puts a buy order where everyone else is putting a buy order, he’ll be lucky if he gets 10% of his order filled.
So what does Bob need to do?
That’s right Bob needs to be buying where everyone else is selling.
Bob is a big player in the Aussie and the market rarely bottoms without him.
That means if you’re buying before Bob does and you have a tight stop, that stop’s getting hit.
Bob is the smart money and you need to understand how the smart money trades.
Bob isn’t out to get you, he’s just trying to get filled.
It’s not personal, you’re just collateral damage.
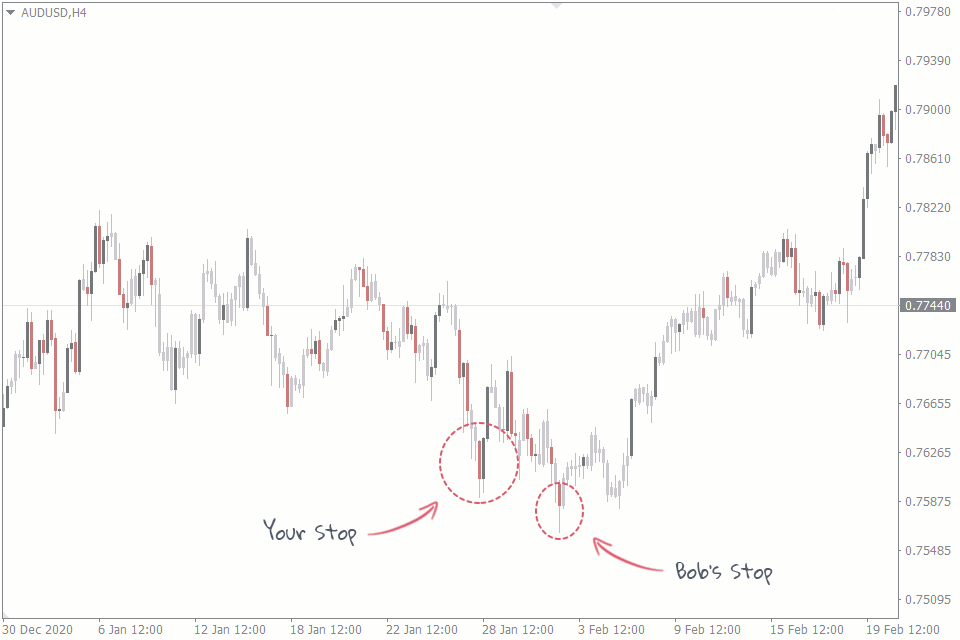
The liquidity pool is where you got stopped out and where Bob bought.
In the next section, let’s see if we can find where Bob wants to do business on a chart.
What liquidity pools look like
We didn’t have to scroll back very far to find a liquidity pool as they are almost everywhere:
In the above example, you waited patiently for a buying opportunity on the Aussie, saw the Bullish Engulfing candle and jumped in with a stop below the low.
Things looked great for a few hours so you held your trade, but eventually the market came back to and beyond your entry.
Here you either got stopped out for a loss, or if you trailed, you got stopped at breakeven.
Either way, when the actual bottom does come and price rises, you are no longer in the trade and Bob is.
After the fact, liquidity pools appear as false breaks, take a few minutes to look at your charts and you will see them everywhere.
Identifying liquidity pools
It’s not much use identifying something after the fact, hindsight is 20/20, but it’s very difficult to monetize.
Not to worry, identifying liquidity pools is very simple.
Just look for the most obvious and agressive place you could place your stop – a recent swing high or low.
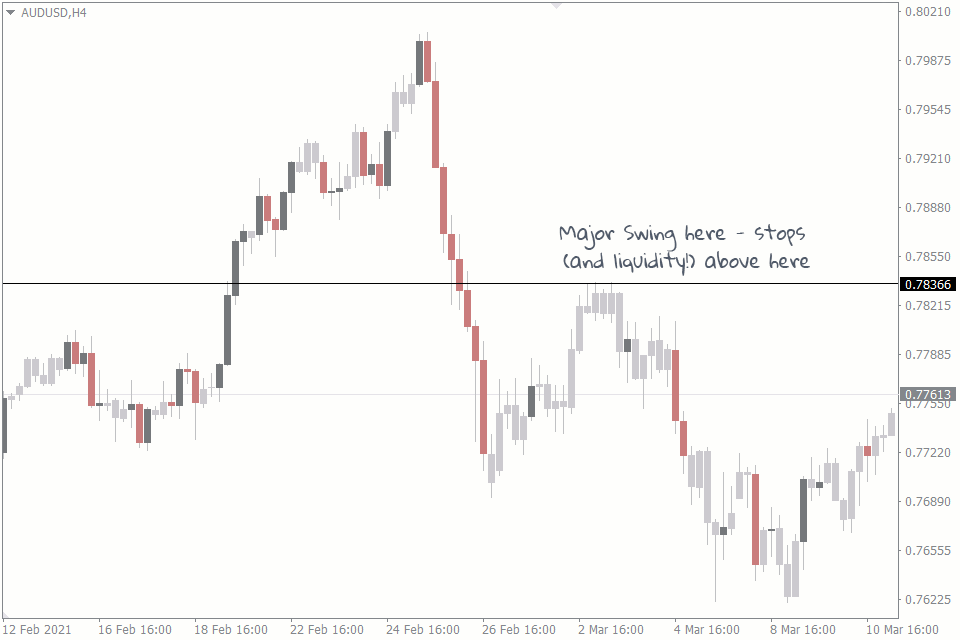
Let’s take a look at another example on AUDUSD, but this time on the short side:
This is a major swing level, we know people will be shorting against it with stops (and liquidity!) above.
Let’s see what happens:
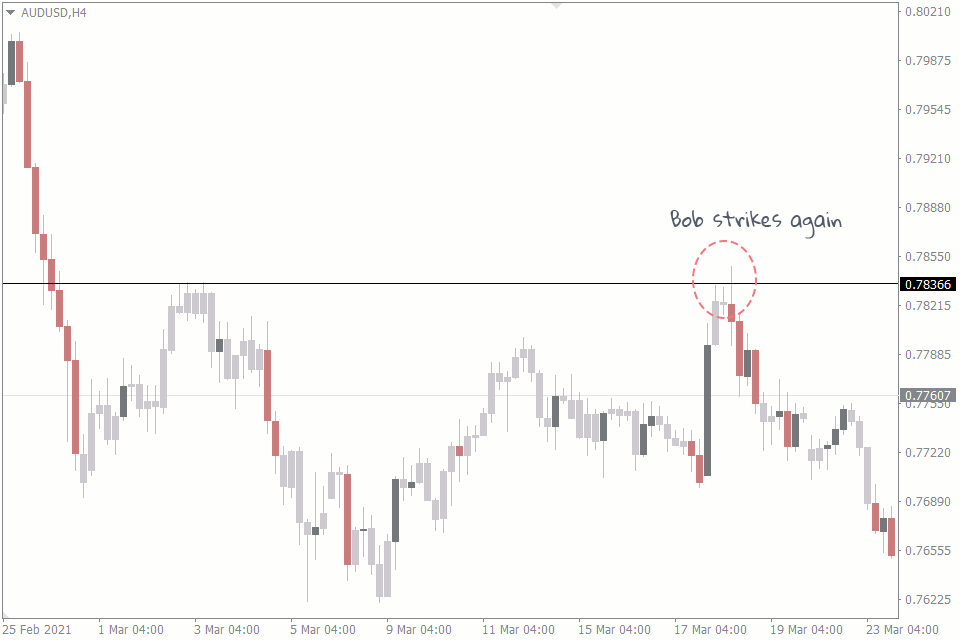
What do you know?
The level is breached, stop orders want fill and Bob is happy to fill them.
Identifying liquidity pools is as simple as finding glaringly obvious points of support and resistance, where traders are likely to place their stops.
Using indicators to confirm liquidity pools
Even though liquidity pools can be quite easy to spot using sheer price action, it can’t hurt to have a couple of extra tools up your sleeve.
Forex indicators are great for both increasing your accuracy and increasing your confidence.
Fading a breakout takes significant courage and grit.
After all, you only know it’s a false breakout after the fact.
If you have an indicator confirming your hunch this becomes a lot easier.
Support and resistance indicators like Pivot Points will confirm the level you are looking at is important and a reversal indicator like RSI will help with your entry signal.
Why stop there though?
After all these indicators are just derived from your charts anyway, they are just a different way of looking at price.
If we are trying to identify where stops are in the market, shouldn’t we look at exactly that?
Two indicators immediately spring to mind: FXSSI’s Order Book Indicator for MT4 which will show you where stop orders are, along with a bunch of other neat stuff.
If you’re only interested in stops however, our MT4 Stop Loss Clusters indicator is the perfect solution.
Both of these indicators take the guesswork out of identifying liquidity pools by showing you exactly where traders are placing their stops and letting you see the market like a market maker.

