What Are the Most Volatile Stocks in 2026 and Should You Look for Them?
Sharp spikes in stock prices can make any trader uneasy, especially if they are a beginner. However, high volatility is not always a bad thing.


We'll get to the most volatile stocks in a second, but first things first. Let’s get the terminology out of the way.
Simply put, volatility is price changeability. If the price slumps or shoots up sharply, this usually leads to high volatility. And when the price is fluctuating at a certain level for a long time, volatility decreases.
The concept of volatility can relate to both currency pairs and the entire stock market.
Today, however, we will focus on the most volatile stocks, we’ll figure out how to look for them and why you might need them at all.
The List of the Most Volatile Stocks
Let's take a look at some of the most fluctuating shares of the companies trading on the US exchange markets as of February 2021.
The volatility of specific stocks depends on the industry, the size of the company, the amount of shares being traded (free float), financial statements and other factors.
The most volatile stocks can demonstrate price fluctuations of up to several hundred percent during the day.
It is believed that the blue chips – the most popular stocks of the largest companies – are less volatile than the shares of medium and smaller businesses. The same goes for young companies from promising sectors of the economy.
Volatility reflects the overall risk of investing in stocks. The higher the volatility, the more risky the investment.
At the same time, volatility indicates the potential for asset value growth. All things being equal, a stock with high volatility can bring major capital gains. The thing is that the share price in this case drops rather significantly, therefore, the investor can buy more stocks at a lower price.
The Most Volatile Stocks: Where and How to Look For?
So, where can one find the most volatile stocks? There are nearly 3,000 companies listed on NYSE alone with the average daily trading volume reaching 6 billion shares. It’s quite unlikely that you’re going to manually search for high volatile stocks on this endless list. What can you do about it?
In this case, the stock screener comes to the rescue. This is a special web service that allows you to sort shares by a variety of useful filters (by volumes, changes in volatility, economic sectors, etc). A careful selection of stocks based on the data from such a tool increases the chances of successful trading.
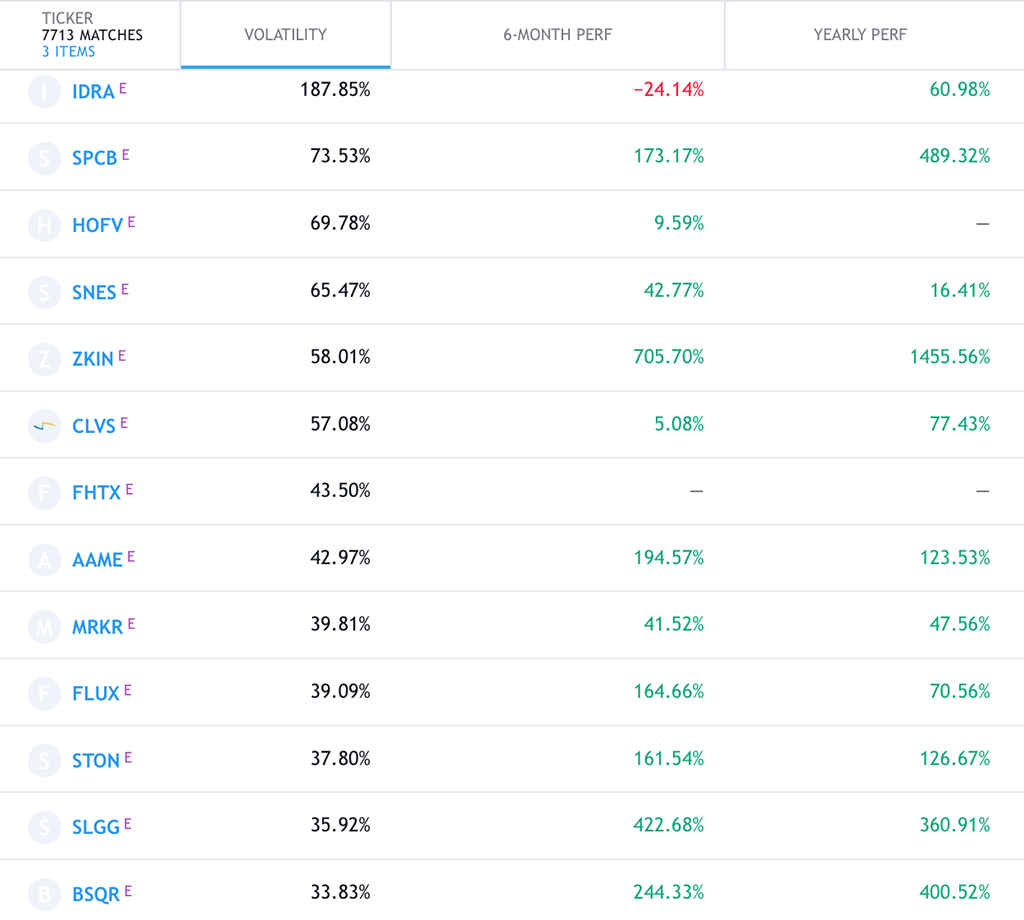
Let’s take a look at this screener below, for example:
Here you can find quite a few parameters – from the number of employees at a certain company to data from accounting reports. Most of the fields will have to be filled in manually, which might not be very convenient, especially for those just starting to find their feet as traders.
But it's always better to spend a little more time to understand the theory and grasp the meaning behind different variables before plunging into the whirlpool of trading blindfolded, don’t you think?
If you’re not sure where to start exactly, it’s better to check out the automatically generated tables of the screener. We have selected the “Performance” option showing us all the vital information on the most volatile stocks across the US exchange markets.
You can choose any of the available tables, like the “Dividends” one, for instance, to see if any of these volatile stocks have yielded anything and how much dividend per share there is, if any.
Even though such tables are compiled automatically, you can still adjust them according to your needs, i.e. you can select which columns to add or remove.
Building a List of High Volatile Stocks
Any screener you choose usually has the Filters section – this is where all the fun begins.
Filters allow you to make a selection based on criteria that relate to the company data. These include descriptive, fundamental and technical characteristics. The more fields you fill in, the smaller and more accurate your final list of stocks will be.
Please note: you must at least have a basic understanding of multiples and financial indicators and realise what kind of information you’re looking for exactly. If you don’t have any trading strategy at all, the screener will only confuse you.
Descriptive Filters
This section allows you to narrow down your search of volatile stocks by choosing companies’ market cap, economic sector or specific industry, average volume of shares traded within a specific period of time and more. Sometimes there’s an option to even select a certain stock market index that you’re interested in.
Fundamental Filters
This section contains various multiples and financial indicators such as P/E, P/B, P/S, ROE, Debt/Equity, EPS and many others.
Price-To-Book, Price-To-Sales and other ratios in this group compare the market value of a company with various performance measures, such as net income or sales, for instance. These values help investors figure out whether a stock is overvalued or undervalued and compare its price with the ones within the industry.
ROE, ROA, and ROI demonstrate the efficiency of a company’s management and investment. For example, ROE shows how much profit a company makes on equity capital. It helps investors to look for companies that generate assets, rather than burn through them. It's usually a good sign when this value is slightly higher than the industry average and close to the ROE of the S&P 500 index, for instance.
Debt-To-Equity, Current Ratio, and Quick Ratio estimate how much debt the company has and whether it’s able to handle the debt load.
As a rule, there is an average value for each indicator in this section. But it doesn’t sound reasonable to focus solely on the mean of such data: these numbers differ in different industries, countries and even in various sources of information.
Another interesting value worth looking into is the data from financial statements. This is the information from the accounting report and profit and loss statement. For example, Ebitda multiple. Investors use this data to assess the financial health of a company and compare organizations with different tax regimes from different industries and even countries.
Technical Filters
These filters are useful for position investors and traders because they allow you to choose the best time to buy stocks.
You can always play around with filters in different sections to get the list of top volatile stocks from the companies with largest market cap, for instance. Or adjust your filter settings to display the most fluctuating stocks of the companies with the highest ROI for the past month.
Remember that the screener simplifies and speeds up your search of volatile stocks. However, this is only an assistant, it won’t implement the investment strategy instead of you, it won’t choose the stocks for you and it’s not a guarantee of generating a profit.
Please also note that screeners are developed by people, so make sure to carefully check and study the data on the shares you choose in the end.
What Causes Stock Volatility?
In reality, the overall volatility increases when there’s an important event that affects the entire market, industry or a particular financial instrument. For instance:
- if there’s a rate change;
- if new credit risks appear;
- if the cost of gas and oil fluctuates on a global scale;
- if there are some manipulations on the financial market;
- if there’s an unstable political situation;
- if there are any natural disasters, wars, etc.
As for stock volatility in particular, it’s largely affected by the interest in the company. If the products (or services) of the company are in demand, and there’s a great deal of those, who want to become shareholders, then the actions of market participants will affect the price of this company’s stocks.
A great example of highly volatile stocks is the shares of the American biotech companies. These firms are developing promising drugs that must be approved by the FDA. The approval process is divided into several stages, and the decision of the American federal agency on each of them causes a surge in the shares' volatility.
For example, on August 18, 2019, the FDA refused to approve Sarepta Therapeutics' new drug Vyondys 53, which was intended to treat Duchenne muscular dystrophy. The next day, the company’s shares plummeted 15%.
But on December 12, the federal agency changed its decision and approved the new drug. As a result, the stock price shot up 31%.
High Fluctuating Stocks: To Buy or Not to Buy?
Investing in any stock involves a certain risk, which can be mitigated by careful planning. Volatility is one of the four main criteria for assessing the profitability of a share. This is why experts suggest to monitor it, especially if you’re aiming at earning a stable income by investing in the stock market.
It’s crucial to remember that high volatility may come in handy for short-term investors specifically. The difference in the buy and sell stock price at the moment of high fluctuation on the market increases significantly, which can generate a handsome profit.
However, you should realise that you will be able to make money only if you assume the direction of the price dynamics of your stock correctly. If you make a mistake, the level of risk dangerously increases.
A Few Words on Calculating Stock Volatility
The past movement of a price is very important for calculating volatility. Sometimes a sharp increase in price does not cause high volatility. This happens if the stock’s price has been decreasing before it skyrocketed. The sharp jump has simply brought the current price closer to the average value compared to the previous periods. As a result, the volatility has hardly changed in this case.
The way of calculating volatility depends on its type:
- Historical volatility. It shows the changes in a stock’s price over a certain period of time (day, month, year, etc.). Experts try to predict the future stock volatility based on this data.
- Implied volatility. It’s calculated based on the current value of the stock, assuming that the market value of the same stock reflects the expected risks.
- Expected volatility, i.e. the value that was expected in the past. This is a so-called archive of predicted values.
There are two traditional methods for calculating stock volatility:
- Relative to itself. In this case, one compares the range of the graph movement of one stock in the past with its movement in the current period of time. This way it’s possible to determine the range of average fluctuation.
- Relative to a general market indicator. For instance, the volatility of a stock market index is calculated and compared to a single share. For the US traders, this is the S&P 500 index.
The first technique is useful for short-term investors: it’s important for them to track periods of calm and activity in order to figure out and correctly predict the price spike.
The second technique is useful for long-term and somewhat conservative investors. For example, one can build a balanced investment portfolio, which will include a limited range of fluctuations. Such a portfolio will provide average stock market return, but without abnormal spikes and slumps.
One Last Thing…
Volatility can enormously benefit traders, but it can interfere with the plans of a long-term investor. That’s why it’s useful to keep track of the volatility indicators. It can become a part of the technical analysis, and it’s useful for assessing risks and choosing stocks to buy or sell. The main idea is that the higher the risks, the higher the profit, and vice versa. The goal is to find a balance between the desire to make money and the willingness to incur potential risks.