Rectangle Pattern - How to Effectively Use It in Your Forex Trading
The rectangle pattern forms when parallel support and resistance levels cover the price at the top and at the bottom. You'll often find this pattern during consolidation in trending markets.


Even though the rectangle is a relatively simple technical analysis pattern, it can significantly improve your trading experience if you know what strategies go well with it.
First, let's see what happens when a rectangle pattern forms: the price bounces within the support and resistance levels until it breaks out at the top or the bottom, depending on the preceding trend.
There are two types of rectangle patterns: bullish and bearish.
Bullish Rectangle Pattern
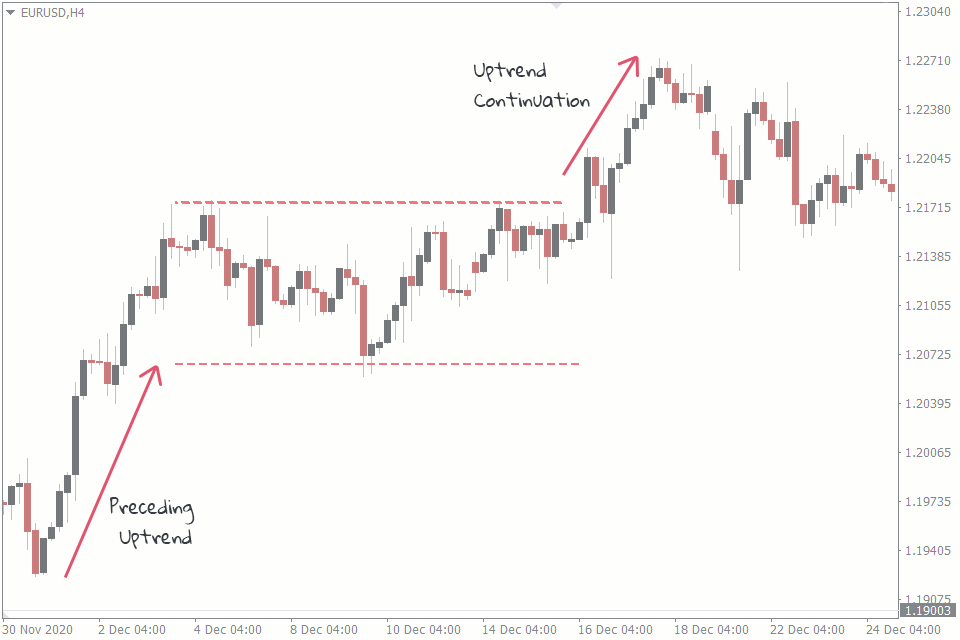
The bullish rectangle pattern occurs in a bullish trend. During the trend, the price lapses into a temporary consolidation, which appears as a rectangle, before continuing to move in its previous direction.
Bearish Rectangle Pattern
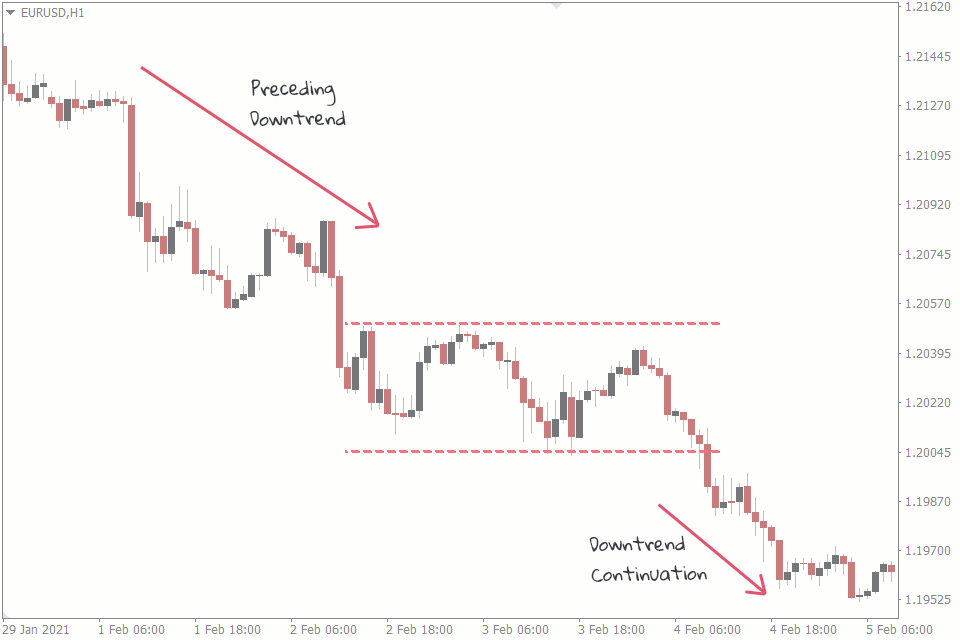
The bearish rectangle pattern occurs in a bearish trend where the price is making a temporary consolidation. And soon after this consolidation, the price continues to move in the bearish direction.
How to Trade the Rectangle Pattern in Forex
There are two major ways of trading the rectangle pattern. The popular one is the breakout strategy, and the other method is trading the range.
Rectangle Breakout Strategy
The idea is to trade the breakout from the rectangle. Here are step-by-step guide ways
- Step 1: Spotting the rectangle pattern.
Try to spot the rectangle on a chart. The best place to find it is in a trending market when it's consolidating after a bullish or a bearish move. - Step 2: Drawing your support and resistance levels.
Establish the support and resistance lines. Make sure you draw the support and resistance levels properly This will help you avoid false breakouts. - Step 3: Finding the right trade entries.
This is where you wait for the breakout before making any trade.
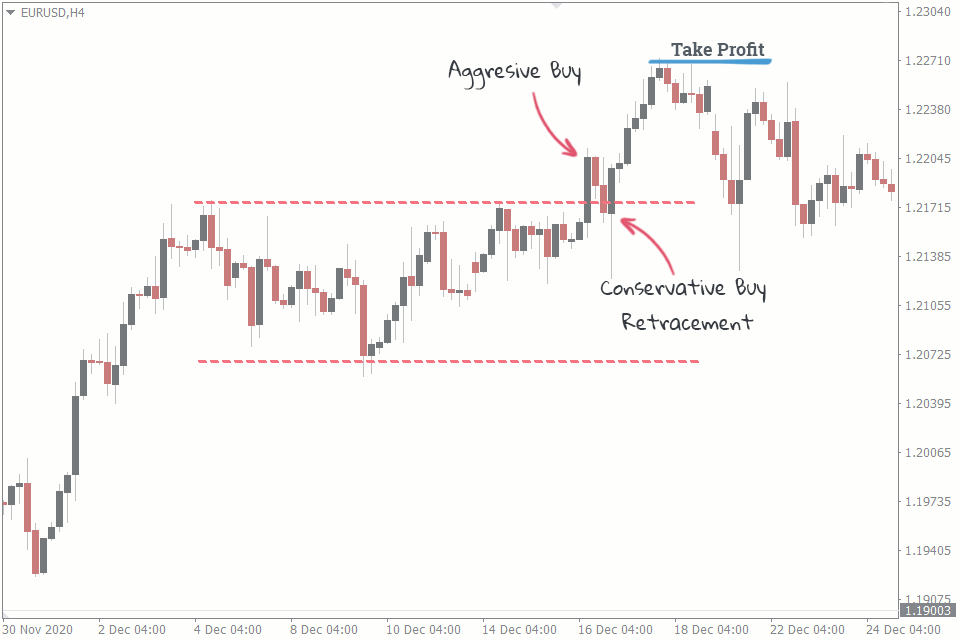
In a bullish rectangle pattern, for instance, the conservative approach is to wait for the price to make a retracement back to the resistance level after the breakout. This is the point when you should buy the currency pair. The same goes for the bearish rectangle pattern The only difference is that there's a breakout of the support level.
This approach helps you avoid false breakouts, but it often requires patience and self-discipline. The aggressive approach to trading this strategy is to place a buy order as soon as the price breaks out. The downside to this approach is that in this case it's harder to avoid a false breakout.
Another way to trade this strategy is to set a pending order above or below the resistance or support level, depending on the trend. In a bearish trend, for instance, your sell stop order should be a few pips below the support level.
- Step 4: Taking profit and stopping losses.
The ideal take profit level for the rectangle pattern is at a distance equal to the gap between the resistance and support levels. If there are 40 pips between your support and resistance levels, for instance, your take profit level would be 40 pips above or below your entry point.
There are other ways to claim your profit, depending on your trading style. One of them is to use trailing stops. Another way is to exit the trade only when there are opposing signals to what you are already trading.
Your stop loss position should be within the support and resistance boundaries, not too far away from your breakout point. As always, it is safe to risk only about 2% of your account on any trade.
Rectangle Range Trading Strategy
The idea is to trade the swings within the range. Buy when the price is at the support level and take profit at the resistance. Sell when the price is at the resistance level and take profit at the support.
However, this approach is quite risky, since some levels only have few pips within them. And besides, you might be trading against the preceding trend.
Rectangle Patterns vs. Other Consolidation Patterns
It is easy to confuse a rectangle pattern with similar consolidation patterns, such as triple tops or bottoms and multiple tops or bottoms. Like the rectangle pattern, these other patterns also have support and resistance levels bounding them.
The price usually continues in the preceding trend before its consolidation within the rectangle, while the price makes a reversal after its consolidation in multiple or triple tops/bottoms.
There is no way, however, to be certain which of the patterns is going to unfold in a real trading situation. You can only be sure that a pattern is a rectangle, triple tops/bottoms, or multiple tops/bottoms after the pattern has completely unfolded. And it might be not the best idea to open a trade at this point, since it might be too late for that.
But there are ways to deal with a situation when you're not sure which pattern is unfolding at the moment:
Set buy and sell orders above and beneath the resistance and support levels, respectively. This way you will be taking advantage of the breakout, regardless of the pattern.
Wait for a retracement to the resistance or support level before opening any trades. The pattern would have already been clear by then. The only disadvantage to this is that sometimes, the retracement might never come.
Conclusion
An advantage of the forex rectangle pattern is that it is very easy for traders to spot, especially if you're a beginner. All you have to do is trade the breakouts or the range within the consolidation.