No One Would Have Thought Of It Before the Report on New Developments was Put on the Chart
Sometimes, the things we've forgotten about a long time ago bring interesting surprises.

Back in 2015, the first version of the Order Book web tool was released and with it a number of new indicators, such as Middle of the Volume, levels of Gravity and Resistance, etc. (see the picture below).

Back then, testing them on historical data was planned, but many ideas didn’t see their implementation due to the ever-growing load.
And then more recently, we managed to look at the old data for the first time, but from a slightly different perspective, in connection with an active development of the package of indicators based on the trading against the crowd strategy
Most of the derived indicators of the trading against the crowd strategy, the list of which can be found in this article, by the way, should be analyzed according to the data of the latest cast of orders and positions. However, if you look beyond this cast, the “nature” of absolutely all indicators will start to manifest itself. In other words, it becomes evident how and why they work.
Middle of the Oder Book’s Volume Indicator
Moving from theory to practice, let’s consider such an indicator as the Middle Volume Positions (hereinafter referred to as “MVP”). It is calculated as the middle of the volume of the order book of positions. Simply put, the MVP cuts the order book into two halves equivalent in volume.
Observing the position of the MVP in the order book by the current cast, it was hard to understand how to interpret it. When we constructed a chart, things were back to normal.
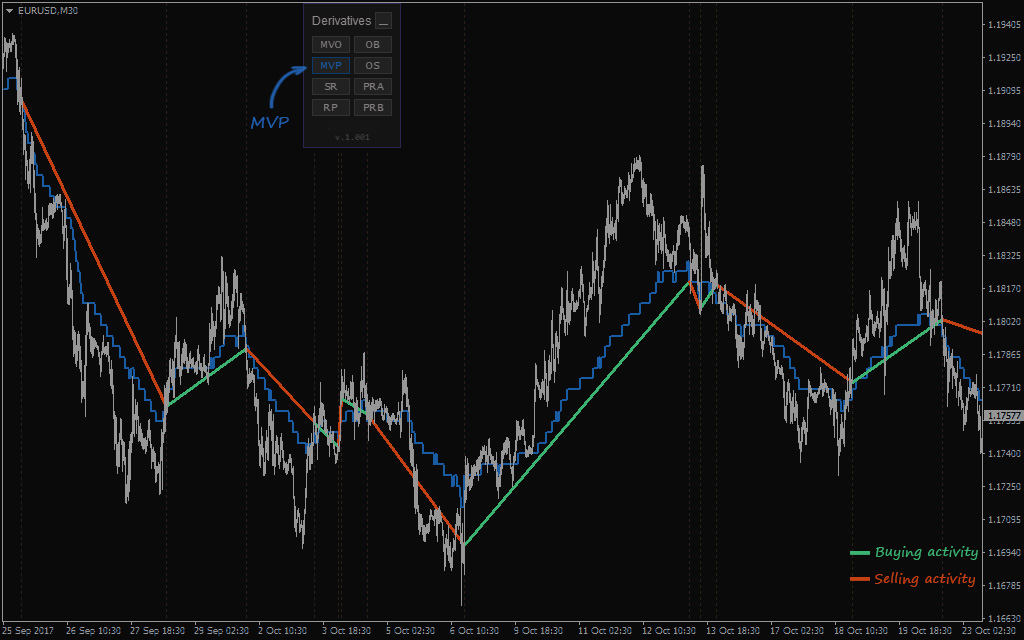
The picture clearly shows that dynamics of the Middle of the Volume indicator represents an excellent trend filter.
If we compare it with the most popular trend indicator (Moving Average (MA)), there will be no data delay inherent in technical indicators in the case of MVP.
If we compare it with the most popular trend indicator (Moving Average (MA)), there will be no data delay inherent in technical indicators in the case of MVP.
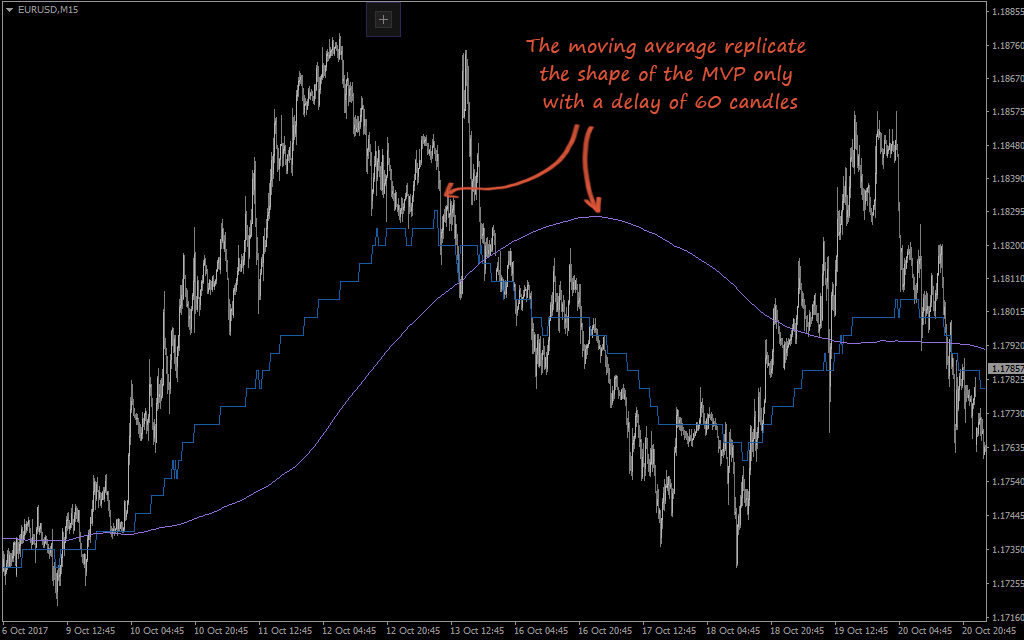
As you can see, the Moving average (shown as a purple line) replicate the shape of the MVP, but with a delay of about sixty candlesticks.
Example of the MVP-based Strategy
It is possible to offer several trading strategies based on this indicator:
- Buy if the price is above the MVP, and sell if it is below it.
- The MVP moves up – buy; the MVP moves down – sell.
- Use the MVP as a resistance or a support.
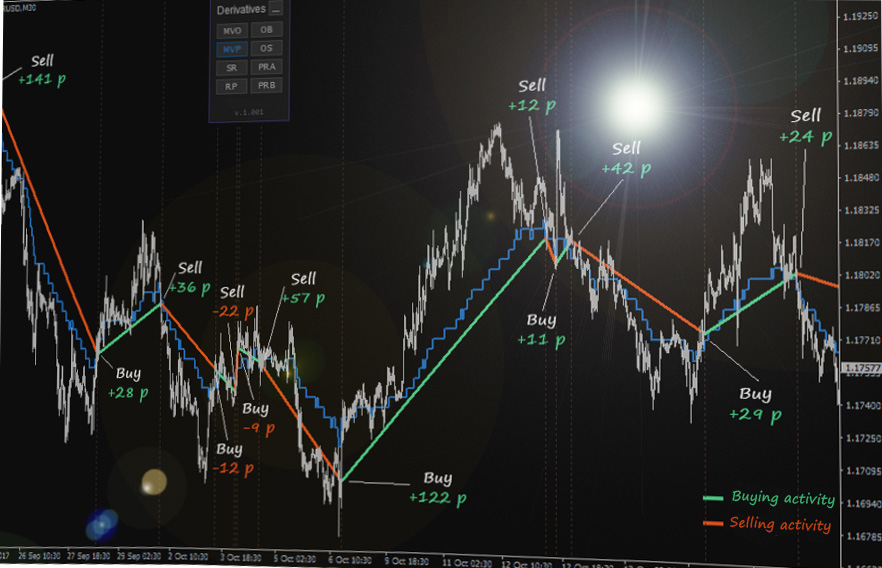
The most obvious thing would be the use of the Middle of the Volume as a trend line: sell when the indicator rises and buy when it falls.
Please note that the Middle of the Volume and many of our other indicators move by 5 points. This is because the ruler in the order book also has a minimum step of 5 points.
If we take two steps of the MVP made in one direction as the beginning of a new trend or the end of a previous one, we’ll get the following trading results:
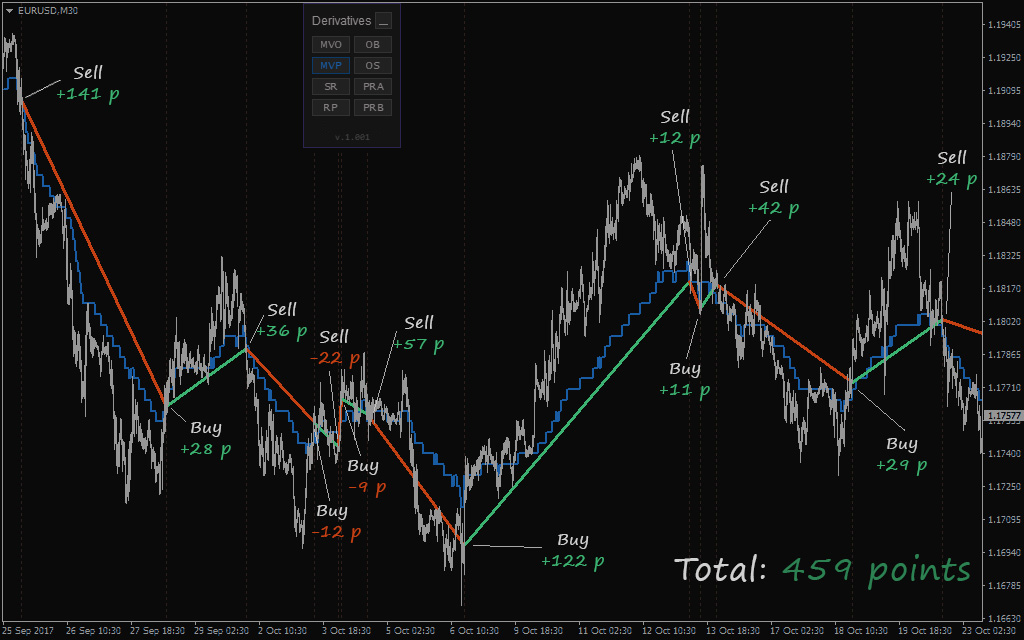
One might earn about 460 points of profit over about a month of trading based on the above-described technique for EUR/USD.
Trades were placed on the chart manually, so there may be a slight error in the results, but the tendency is generally obvious.
Now we’re also going to consider how our trend line (the MVP) will behave on other currency pairs. Let's start with AUD/USD:
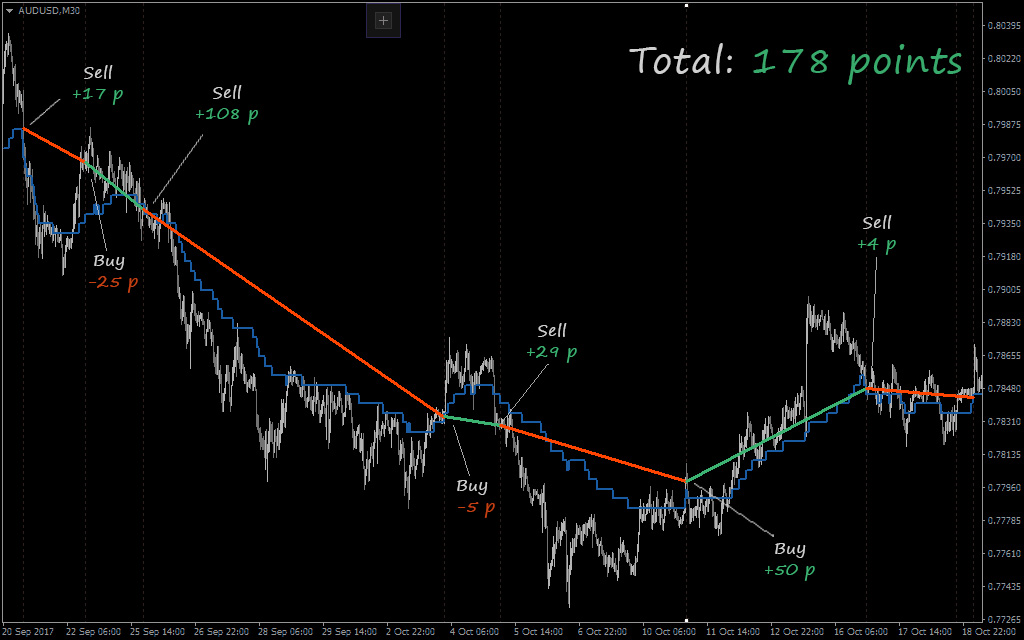
Aussie hasn’t yielded so good profit as EUR/USD, but the final result is positive as well. In the given situation, it’s probably the current nature of the price movement characterized by significant pullbacks and a subsequent come back to the trend movement that has prevented us from making good profit.
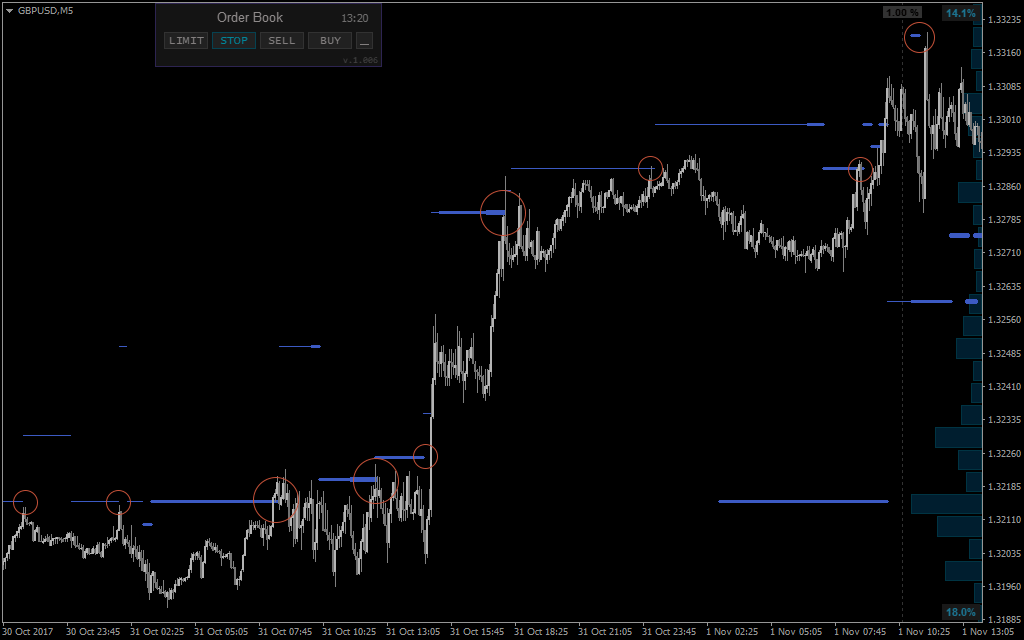
Let’s analyze a little more flat area of the chart using the GBP/USD chart as an example:
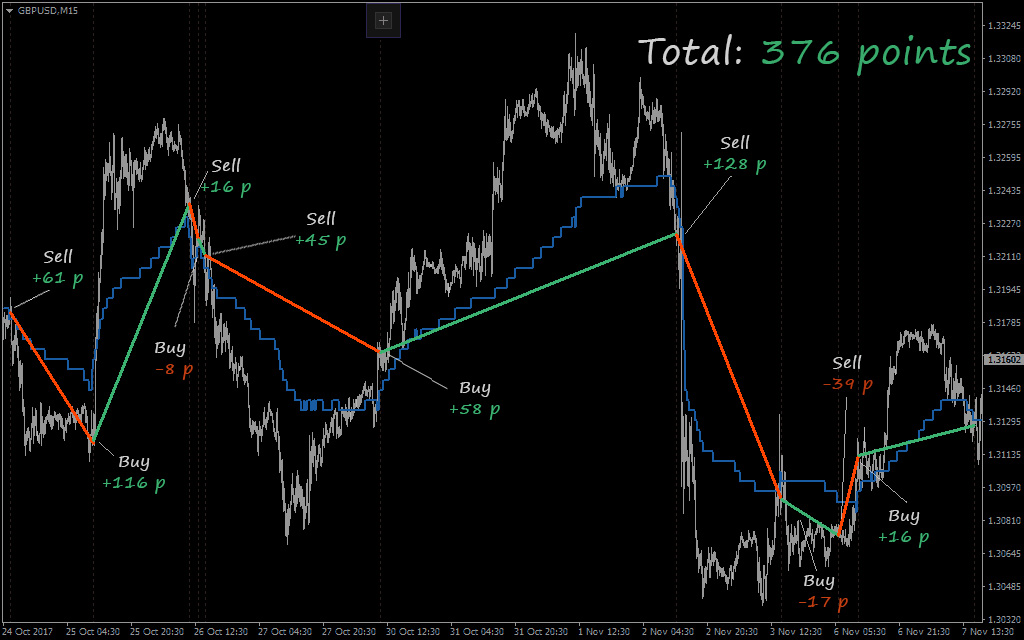
We can see that the MVP also has performed well in these flat areas, while generating profit even during the news.
However, the main purpose of this indicator is following the trend which it copes very well with. Let's analyze the trend area on the USD/CAD chart:
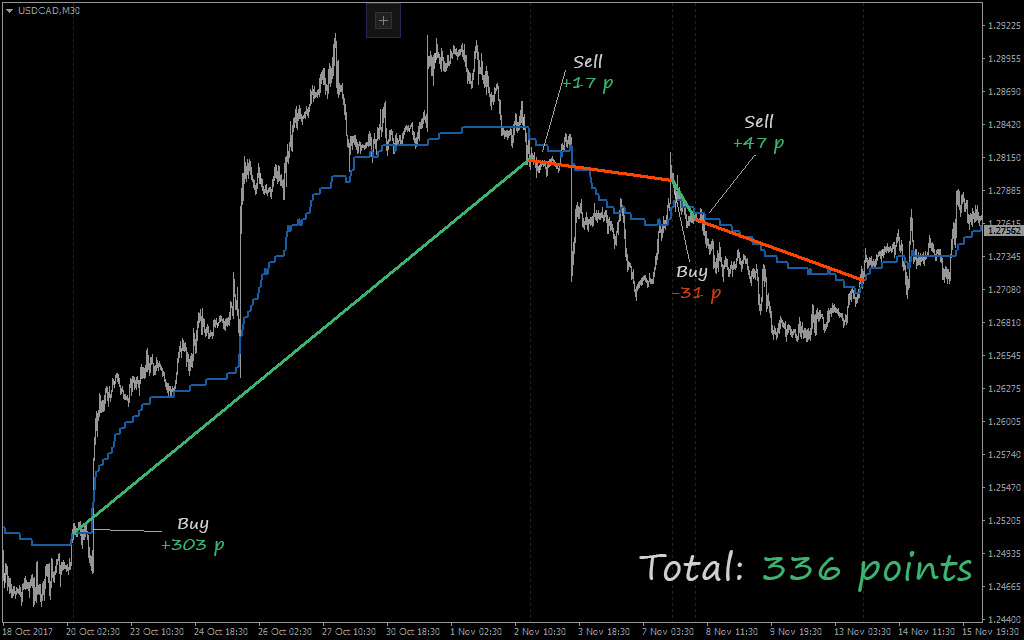
Notably, the indicator has signaled to enter a trade before the start of the main movement and exit it just before the occurrence of a downward impulse. Therefore, it has been possible to capture most of the upward movement.
We’re not going to review the rest of the pairs yet, because this is a very time-consuming task to manually place trades. Perhaps, we’ll test them with an Expert Advisor in the Strategy Tester a little later.
Thus, the MVP can be safely used as an independent trading tool – it means that you can use it to identify both entry and exit points.
The MVP indicator chart is available as one of the parameters in the all-in-one Derivatives indicator.
Another interesting indicator called StopLossClusters was released along with the TradingActivity indicator. Its name suggests that that it displays clusters of traders’ Stop Losses.
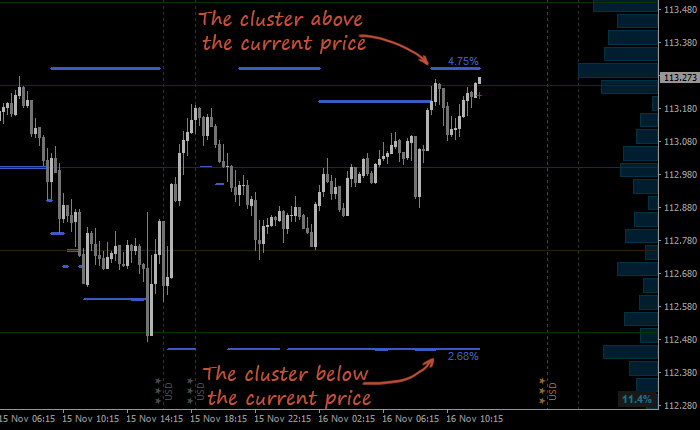
StopLossClusters Indicator
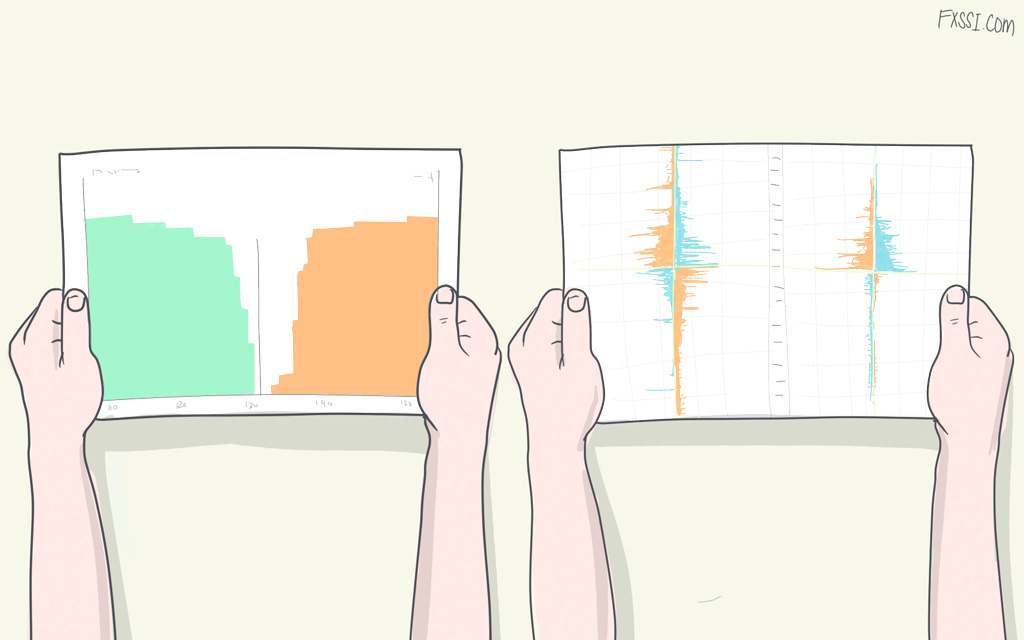
You most likely saw the GR (Gravity) label in the Order Book tool that displays the largest cluster of Stop Losses. In developing it, we decided to divide the Gravity indicator into two analogous ones, one of which is above the current price, and the other is below it. As a result, the indicator displays two clusters of orders on an ongoing basis, as well as the volume of these clusters. Learn more details on the picture:
As in the case with the MVP, we were pleasantly surprised by the picture of this indicator. Even though we cannot calculate the potential profitability of these clusters, since they display only target points or entry points without the other parameters of a trade, but just take a look at how beautifully the price reaches these clusters once they’re formed and moves further in a random direction:
In principle, this is to be expected, because clusters of Stop Losses underlie the “Trading Against the Crowd” strategy.
As for a trading technique, the following statement is applicable to Stop Losses: “Sell where everyone buys, and buy where everyone sells”. Thus, if a cluster of Stop Losses is at the top of the market that implies Buy trades, we should sell at these levels and can do it in two ways by:
- Closing a previously opened Buy trade by Take Profit.
- Opening a new Sell trade.
The following picture shows an example of how the cluster of Stop Losses can be used as a reversal point:
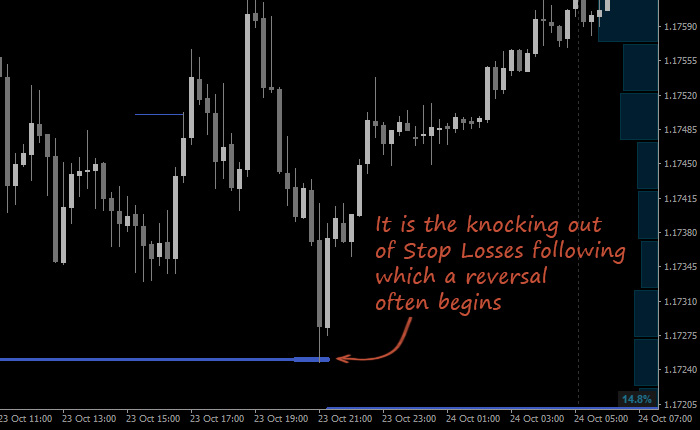
You can receive more detailed information about the indicator and ask your questions on the StopLossClusters indicator page.