Where is the Ratio of Positions in the “Trading Against the Crowd” Universe? Scheme
Many novice traders believe that the ratio of traders’ positions underlies the “trading against the crowd” strategy. Is it so?
Well, people once learned that the Earth was not flat, but round, and it was the Earth that moved around the sun, not the other way around. Of course, the only exceptions were those unique persons who still believe in the flat Earth theory.
Later, the sun was regarded as the center of everything, but that wasn’t the case as well. In fact, the sun is only one of the stars in the galaxy, and very far from the center of the galaxy itself.
The above-mentioned path of “knowledge” was based on the natural process of knowledge-building. First, people saw what appeared on the surface and were right next to them, and only then they learned more and more things over time.
How Does This Relate to the “Trading Against The Crowd”?
We have given this example in order to project the situation on trading and the “trading against the crowd” strategy.
Anyone who begins to take interest in the “trading against the crowd”, first of all, gets to know such an indicator as the ratio of traders’ positions, which is the most easy-to-use and comprehensible. As shown in the above-mentioned example of our Earth, they believe it underlies the” trading against the crowd” strategy.
It’s not unusual that in case of unsuccessful attempts to master the ratio a trader rushes to notify everyone that he/she learned from personal experience that the strategy generally doesn’t work, because its “major” indicator didn’t produce a positive result. There can be numerous reasons for this failure, for example, at least the fact that the trader used the ratio of positions for scalping, while it should be used virtually in the medium term trading.
The given article, however, is not intended to prove the performance of indicators, but it’s aimed at bringing the information that the Ratio is not the “center of the Universe”, but only its outskirts, and the spectrum of “trading against the crowd’s” indicators is just awesomely huge.
Map of the Strategy’s Indicators
We tried to display the indicators we already have and all kinds of their derivatives, as well as what else can evolve in the near future, in the following scheme.
(The image can be enlarged when clicked on)
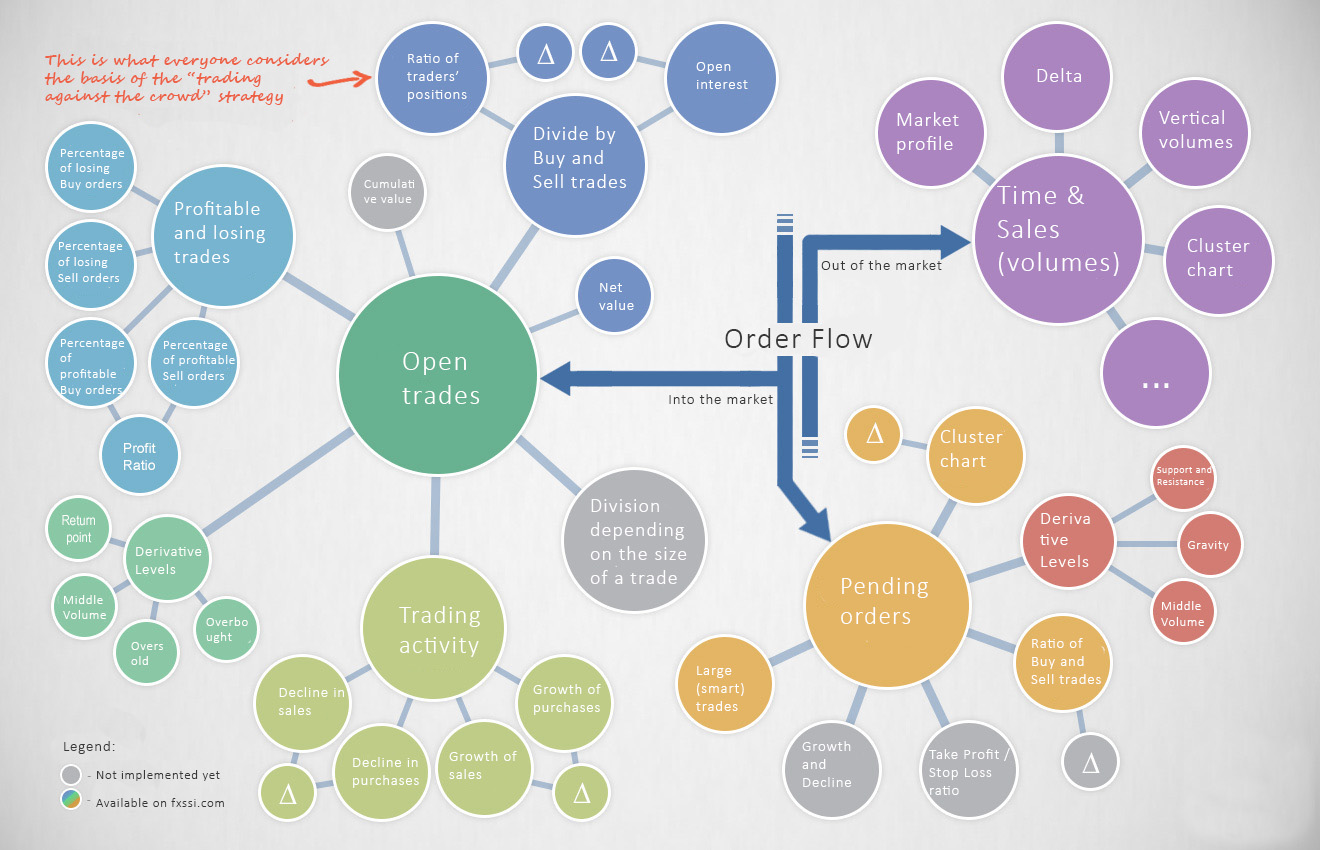
It all starts with the order flow, which can be conditionally divided into the “Flow into the market” and the “Flow out of the market”.
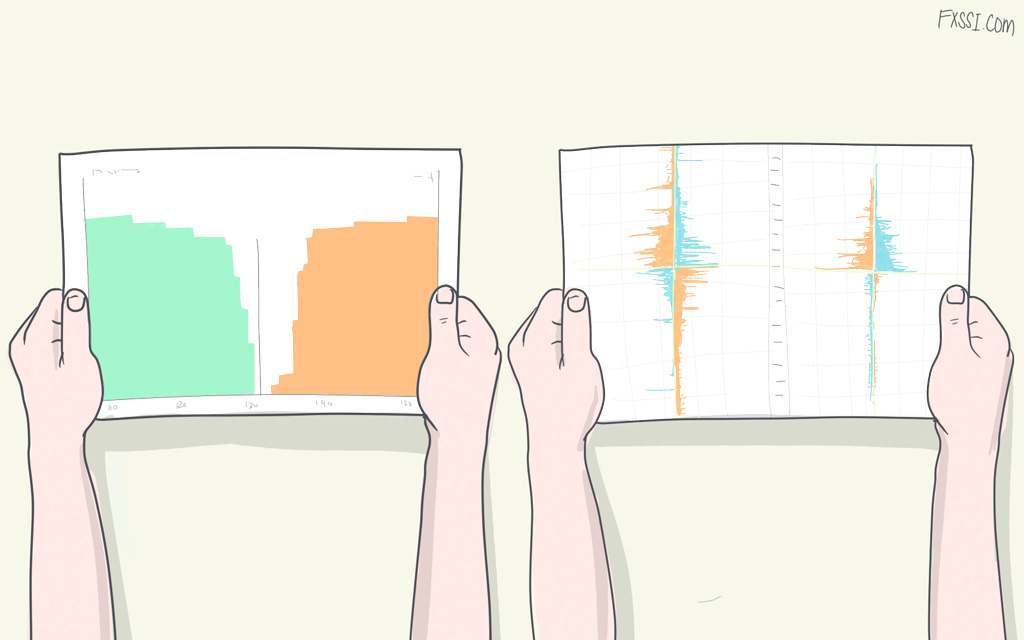
The “Flow out of the market” is the list of already made trades that includes both newly opened and closed trades. The Time & Sales is formed based on the flow and serves as the basis for the well-known tools:
- volumes histogram;
- cluster chart;
- Delta chart;
- and all the other tools included, for example, in ATAS.
The topic of volumes was fully covered on the scheme above. Volumes are not exactly our specialization, although it’s very close to us. If we describe all the derivative instruments that can be built based on the data of futures volumes, the scheme will not be less in size than that related to the “Flow into the market”.
The “Flow into the market” represents all the trades that have yet to be made. For example, if you have placed a pending Buy order, it definitely refers to the “Flow into the market”.
However, when studying the scheme, you may have a reasonable question: “How do already open trades relate to the “Flow into the market”? Let’s make it clear: if we have a certain number of open trades, for example, to buy, then we have the same number of trades to sell in the future. That is, any Buy trade will sooner or later be closed by Sell trade. This is why open trades refer to the “Flow into the market”.
We form two order books based on the “Flow into the market”:
- order book (see for “Pending orders” in the scheme);
- book of open positions (see for “Open trades” in the scheme).
The following derivative instruments are formed on their basis:
- Ratio of traders’ positions.
- Percentage of profitable traders.
- Growth/decline.
- Levels of clusters of Stop Losses etc.
However, despite of the numerous derivative instruments, their basis will always be the most effective. It’s not for naught that experienced volume-based traders say: “See the Time & Sales”. Or in this case: “See the order book”.
Everything described above is very similar to our comparison of the order book with futures volumes, but from a slightly different perspective in this case.
As you can see, the “trading against the crowd” strategy is not only the ratio of traders’ positions, but also many other tools that will often be more informative than the ratio of positions itself.
Therefore, you should never jump to conclusions, especially on a subject you didn’t fully understand.