Bill Williams’ Fractals + Description of Fractals Indicator
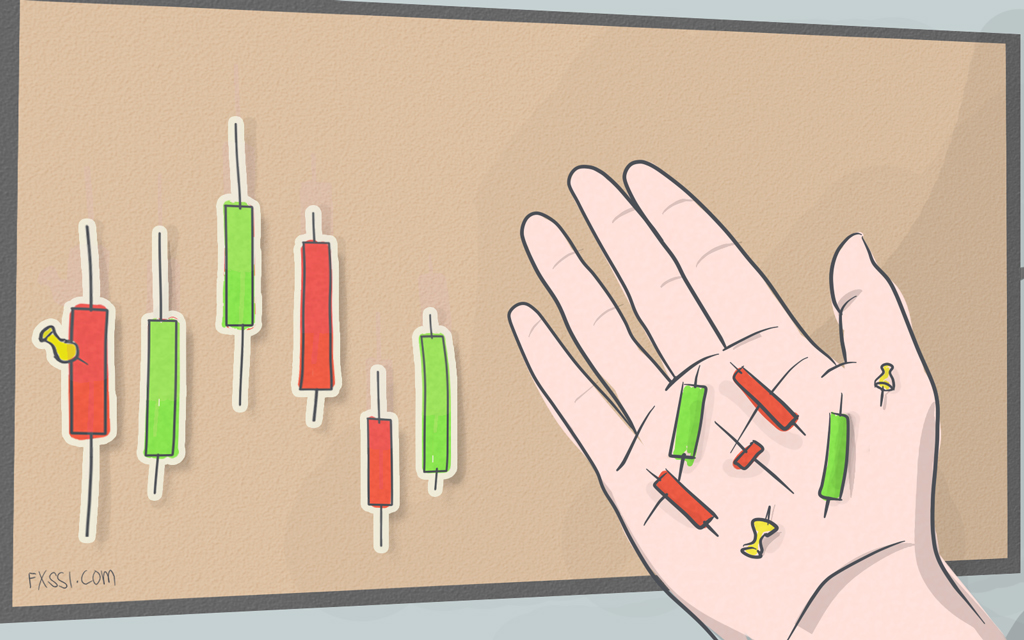
Fractal used in Forex trading is a local high or low, which is marked by an up or down arrow on the price chart. They are indispensable assistants for Forex traders.

For the first time, the concept of “fractal” was developed and introduced in trading by the guru of technical analysis – Bill Williams – in his book “Trading chaos” published in 1995. That was the first time the author described fractals used in trading by the example of stock market analysis.
Description of Bill Williams Fractals Indicator in Forex
A fractal is a formation created by five candlesticks or bars, where the third candlestick always has the highest high or the lowest low as compared to the other ones:
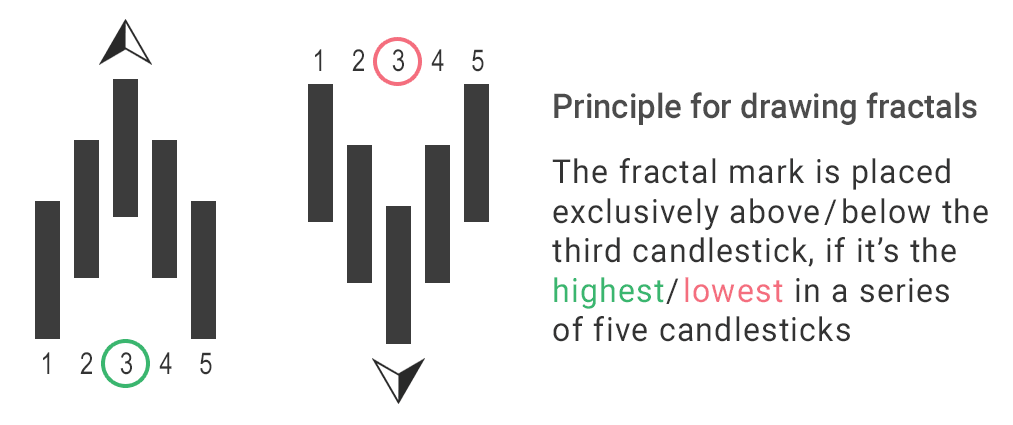
According to Bill Williams, there doesn’t have to be five candlesticks to form a fractal, but it’s the combination of five candlesticks that has gained the greatest popularity due to its inclusion in the list of standard indicators of MetaTrader 4 trading terminal.
It’s worth noting that the interpretation of fractals by Bill Williams has nothing in common with the same concept in mathematics, but this invention became widespread among Forex traders.
The primary advantage of fractals over other technical analysis tools is that they display not only local highs and lows on the chart, but also enable to identify important support and resistance levels for any financial instrument.
Is there a fractal that doesn’t redraw and lag? According to the drawing principle, fractal will always lag by 2 or more candlesticks, and there's nothing we can do about it. Redrawing and lagging of indicators is a dangerous phenomenon, because an indicator can achieve very good backtesting results, but in fact, when a signal occurs, the price is much different from the signal one.
Fractal Breakout Strategy
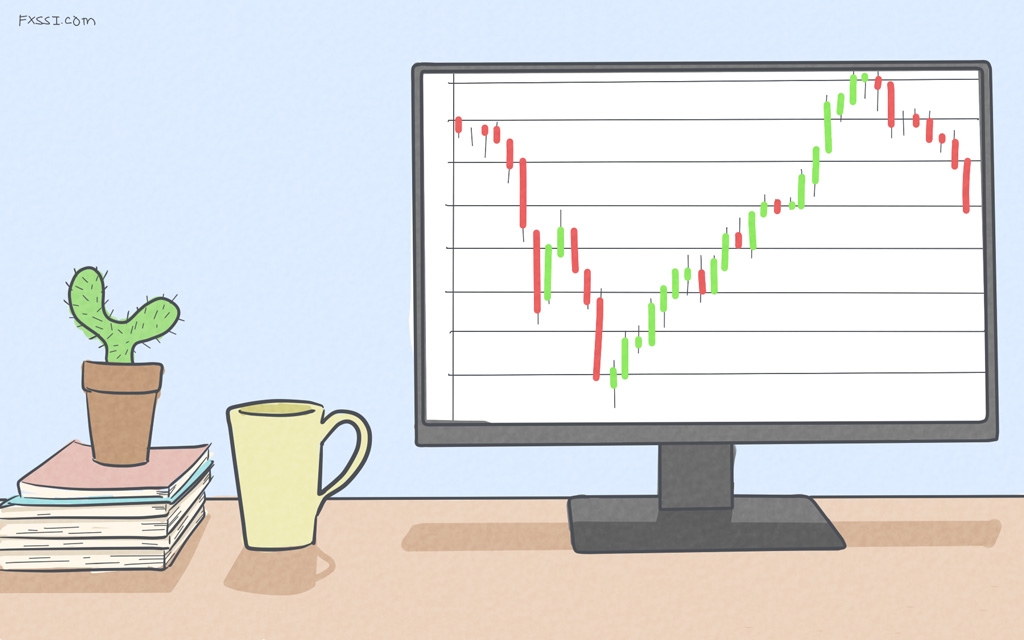
Fractals look as follows on the chart of MetaTrader 4 terminal:
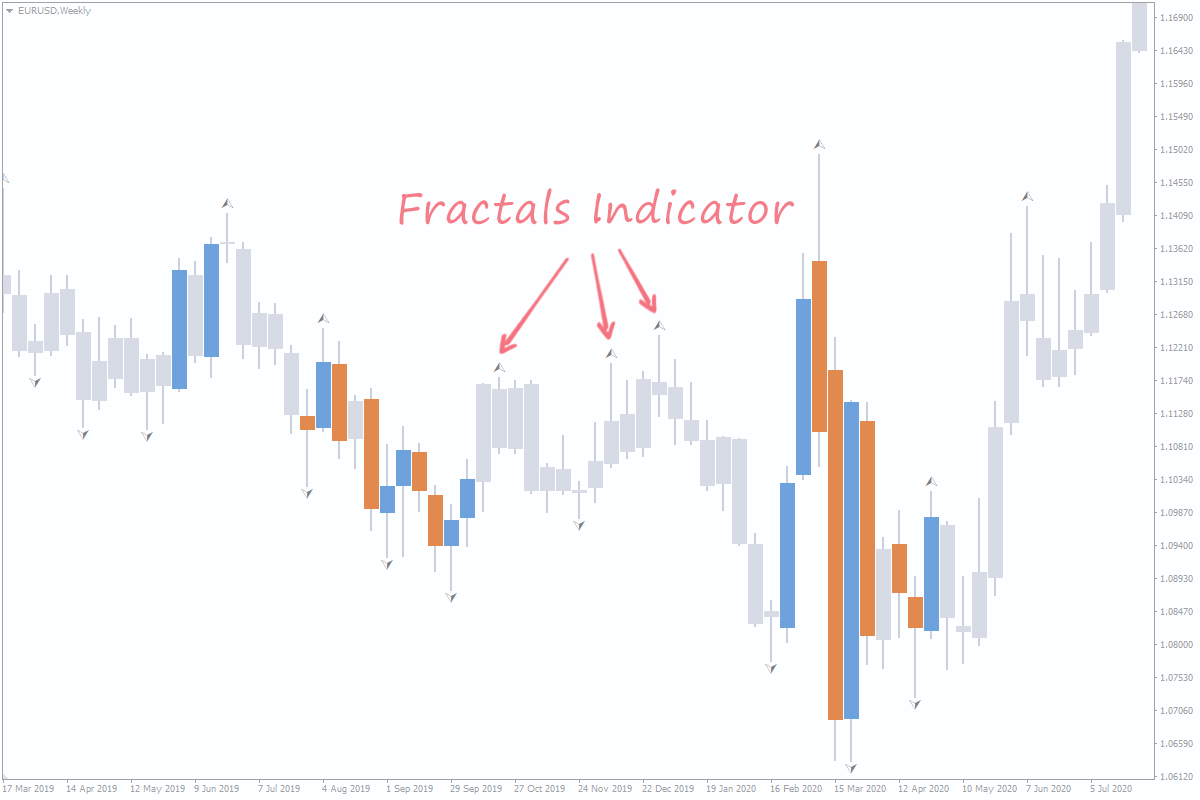
Each arrow on the chart marks a fractal. Since the given indicator is automatically set to draw fractals based on 5 candlesticks, fractals appear on the chart quite often. However, you can search for and download the indicator providing access to its settings, if you wish. That is, you can tell your terminal how many candlesticks must be included in one fractal.
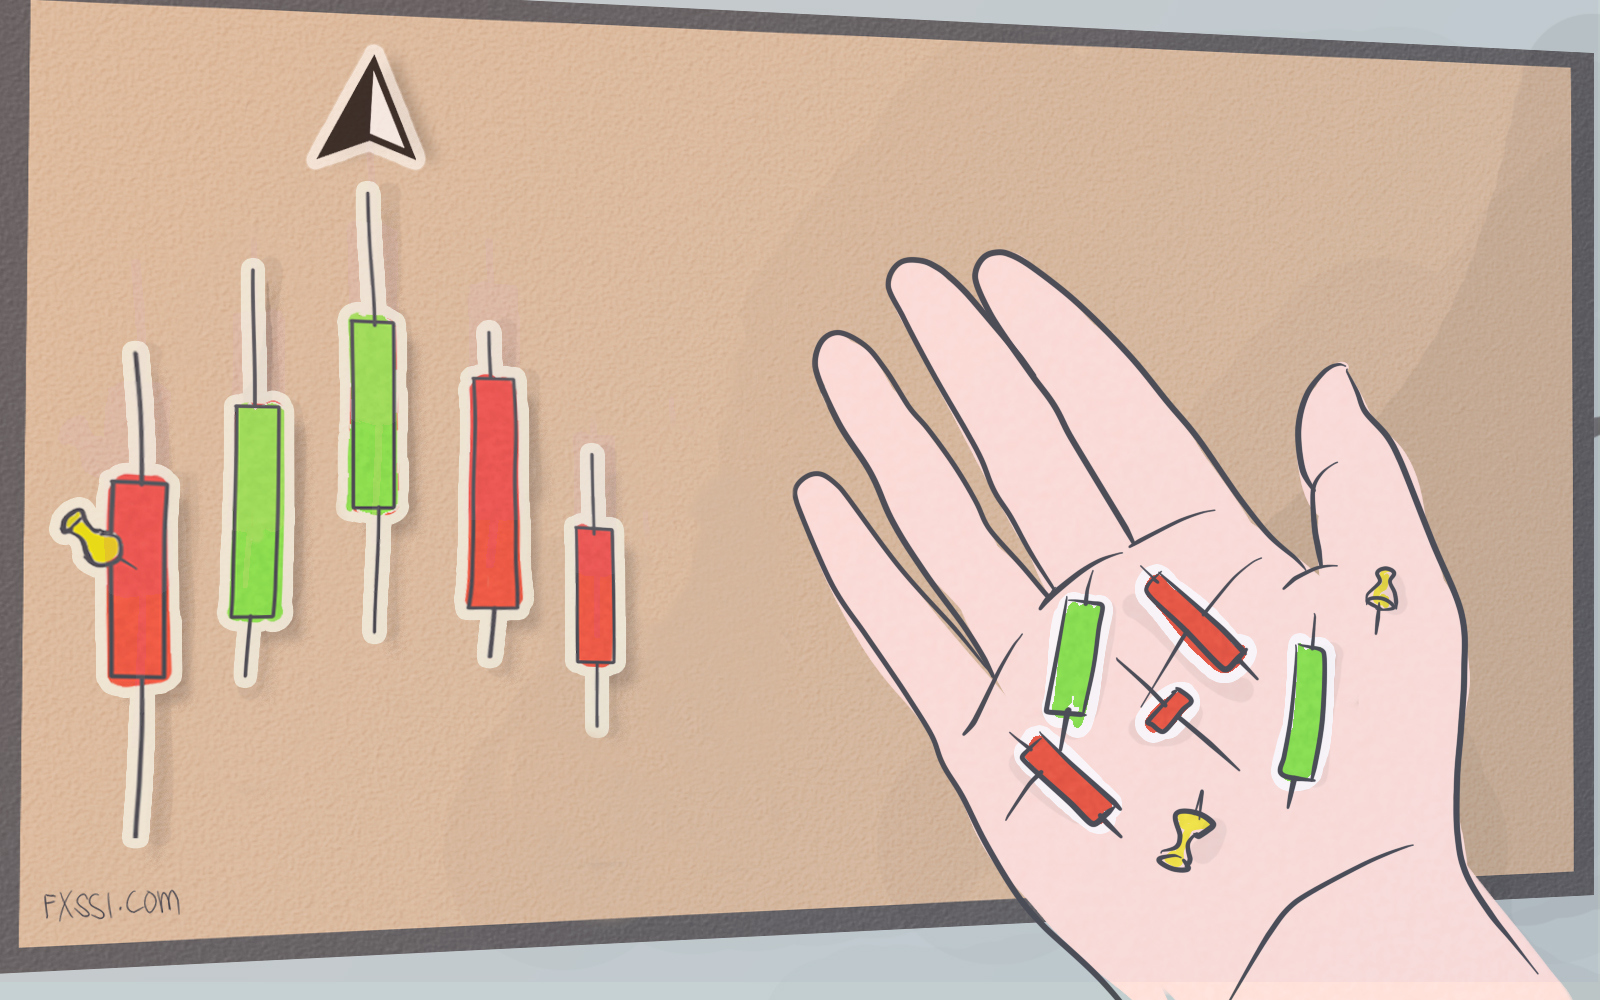
Bill Williams advised to use fractals in the strategies based on breakout of the important price levels. According to the author of this indicator, the price movement for at least one point above or below the level of the previous fractal indicates breakout of this level by the price.
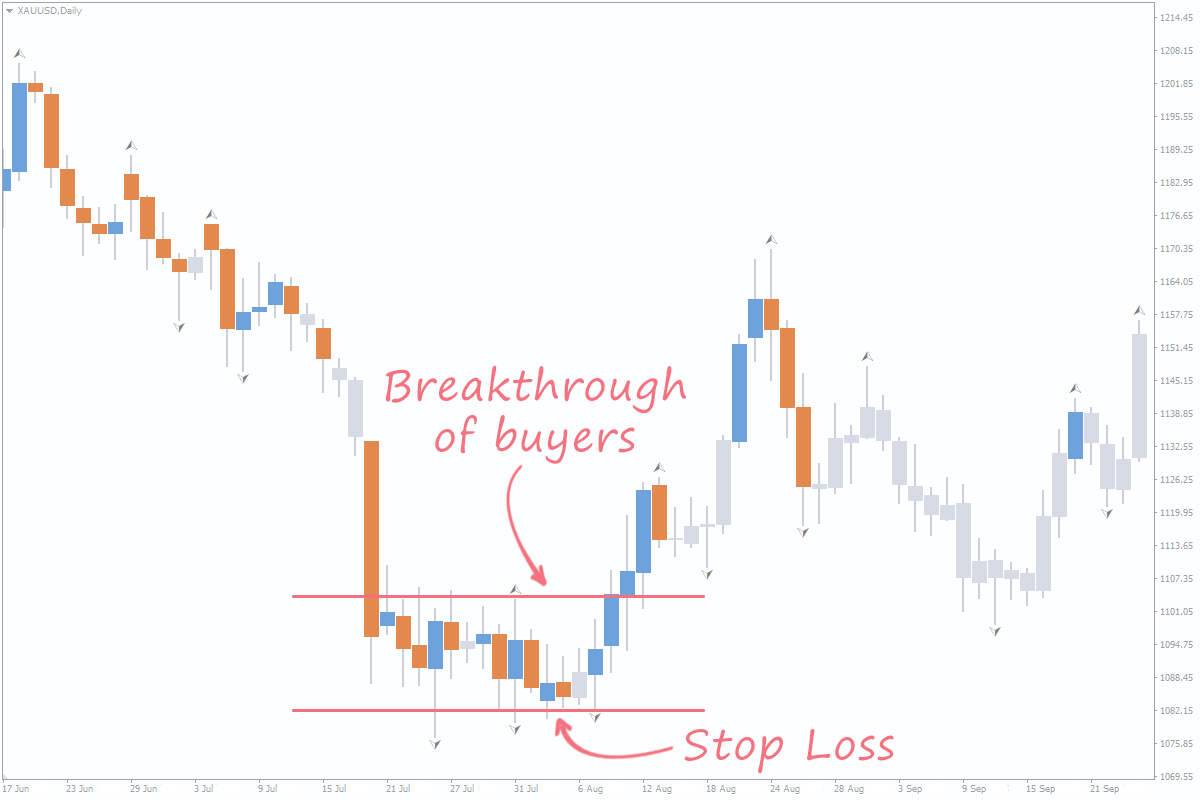
Breakout of the previous fractal level is called a breakthrough of buyers if the price rises above the previous upward fractal. Otherwise, when the price falls below the previous downward fractal level, they call it a breakthrough of sellers. Bill Williams advised to consider a breakthrough of buyers or sellers as a signal to open a position.
As we have mentioned breakouts here is some useful info on Most Common Breakout Strategies in Forex.
Normally, traders place pending Stop orders a few points above or below the fractal level to open a position in case of this level breakout. In such cases, Stop Loss is set at the level of the second-to-last opposite fractal. This situation is shown in the picture below:
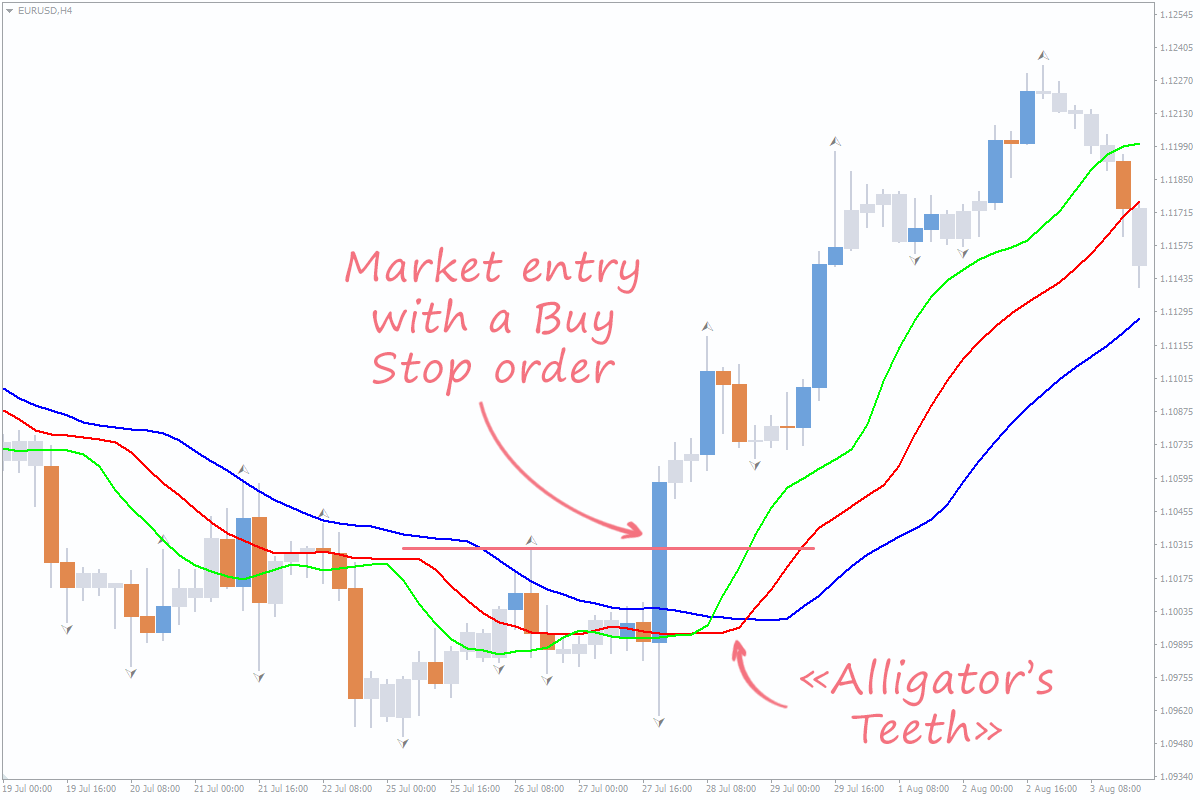
In the classical interpretation, Bill Williams advises to filter trading signals generated by fractals using “Alligator” indicator. For example, if you want to open a Buy position, it’s necessary that the fractal located above the red line (the so-called “Alligator’s Teeth”) is broken out. The author of the strategy recommended to enter the market right after breaking the fractal up or with a pending Buy Stop order. Market entry with a pending Sell Stop order is made in case of breaking the fractal located below the red line.
Fractal “Alligator” System
Bill Williams used fractals along with another his invention – the “Alligator” indicator – in the US stock market, but this approach is applicable both to the stock market and Forex.
You can use another great property of fractals – drawing the Fibonacci grid with them – in the foreign exchange market. As you know, the Fibonacci grid is stretched between a local low and high: this is precisely why traders can use fractals for. Therefore, the area between two fractals can be considered the price movement, which the technique of retracements and Fibonacci extensions can be applied to.
According to the author, fractals are among the few tools of technical analysis that really work. It’s trading strategies using fractals that can yield positive results over a long period of time (500 trades and more).
However, it’s should be understood that a successful trading system cannot be based only on one indicator: another 1-2 tools need to be used to improve its efficiency.
For example, a trader can use fractals to spot the levels of market entries, and the “Alligator” indicator can be used as a filter to avoid opening positions at the level breakout with no trend in the market (flat).