Reversal or Retracement? The Answer Is In Volume
In the previous article, we’ve already mentioned such a notion as retracement, namely, its varieties: narrow, wide, and sideways retracement. It’s crucially important to distinguish one from the other if trading is not just a game for you.


In this article, we’re going to talk about the differences between one type of retracement from the other one, as well as trend reversals, in more details. First of all, we must decide on which nuances we should pay our attention to when trading with each type of retracement. Here are a few rules on retracement identification:
- You must treat a retracement as the pause in the movement. In other words, you need to ask yourself: “Does the one who drives the trend have enough power?”.
- The major indicator of buyers’/sellers’ power is the volume indicator. Assessment of traders’ activity during an uptrend / a downtrend gives an idea of the power and intentions of market participants.
- Delta color change can indicate who’s holding the price, and the color often allows you to determine if there are any large Limit orders in the market.
Narrow retracement is easy to analyze and can be found at the start of a trend, where the initiative of a major player is clearly visible.
Let's get right down to wide retracement, because it represents a longer pause: the longer the time period, the more likely it’s that the initiative may change or simply disappear.
By the way, don’t try to analyze a wide retracement on a higher timeframe, i.e. don’t switch to a higher timeframe so that the candlesticks making up a retracement are down to 2-3. By selecting a higher timeframe, you’ll miss huge amounts of information or the rest of the information will be hard to understand that can lead to unnecessary losses.
Let’s consider a relatively simple example of a wide retracement. The day has begun with the rally, but the medium-term trend is downward, which is evidenced by the previous day characterized by large volumes during a downtrend phase.
As the price rises during the retracement, we note that the volumes decline as compared to those seen during the price fall yesterday.
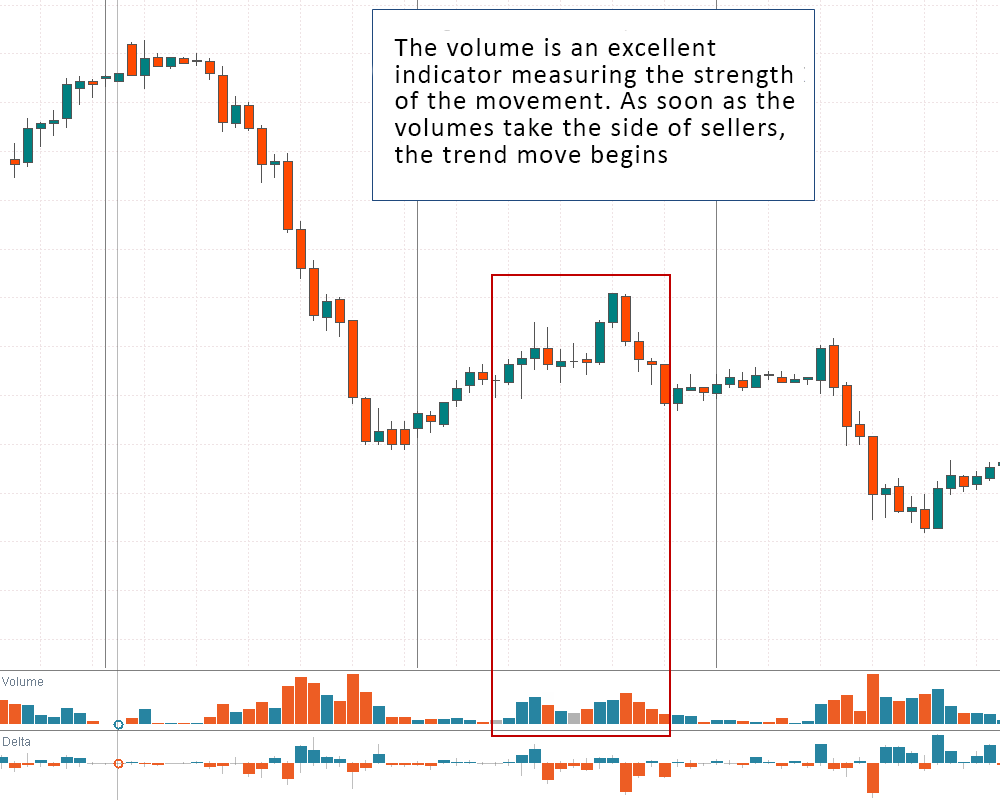
There is not a single falling candlestick having the volume greater as compared to the rising ones in this retracement movement that makes it impossible to assess the power of sellers. However, we remember that the trend is downward in the medium term, so we don’t rush to buy. After a while, the US session begins, and sellers come into play – there are falling candlesticks appearing mixed up with the rising ones. However, the volumes of the falling candlesticks are greater than those of the rising ones. The power of buyers has drained and one can sell again.
Now let’s consider an example using delta. There are times when retracement may be prolonged, but accompanied by a small move: the amplitude of fluctuations is small, but the fluctuations themselves are frequent and lengthy. Simply put, the price stands still, the volumes advance and decline, and the longer it goes on, the more doubts arise.
At times like this, delta indicator can be of great help. Take a look at the picture below, where you can see the following situation.
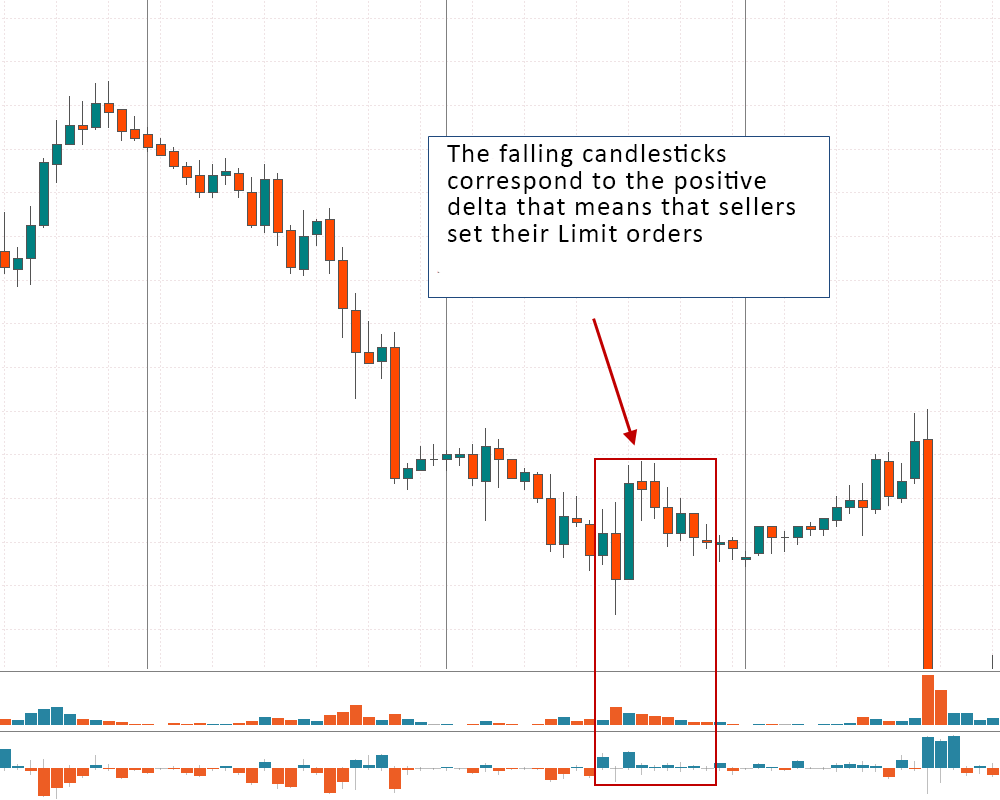
The price is actually standing still, making sharp moves.
Volumes don’t tell anything: they’re advancing and declining, regardless of the price direction.
However, if you look closely, you can see this: the color of the delta corresponding to the falling candlesticks is green. The price is falling, and the number of Buy orders is growing. How is it possible? In this case, it should be recalled that the delta shows the difference between market Buy and Sell orders. The falling price and the positive delta means that sellers place more Limit orders than buyers and it takes a small number of Sell orders placed at the market price to push the price down. If the price is rising, and the delta is negative, it means that buyers place more Limit orders than sellers.
Let’s get back to our situation: the medium-term trend is downward, and the price is currently standing still in the range. We can see that the green delta corresponds to the falling candlesticks – it means that sellers are placing their Limit orders. It turns out that the sellers protect their positions, and buyers don’t. One can place Sell orders relying on those sellers holding the price.
We have considered two retracement-related situations. The indicators’ signals, which are mirror of those described above, will indicate a possible reversal.
If you want to know more about Reversal or Correction, then check out our other article Retracements vs Reversals in Forex Trading.