Retracements vs Reversals in Forex Trading
If you trade any sort of trend following strategy, you’ve at one stage or another wondered if the pullback you’re watching is just a retracement or a full reversal.


By learning the key differences in the retracements vs reversals argument, you’re able to hold onto your winning trades longer and cut your losers earlier.
Just take a look at the two example scenarios drawn on the EUR/USD 30 minute chart below: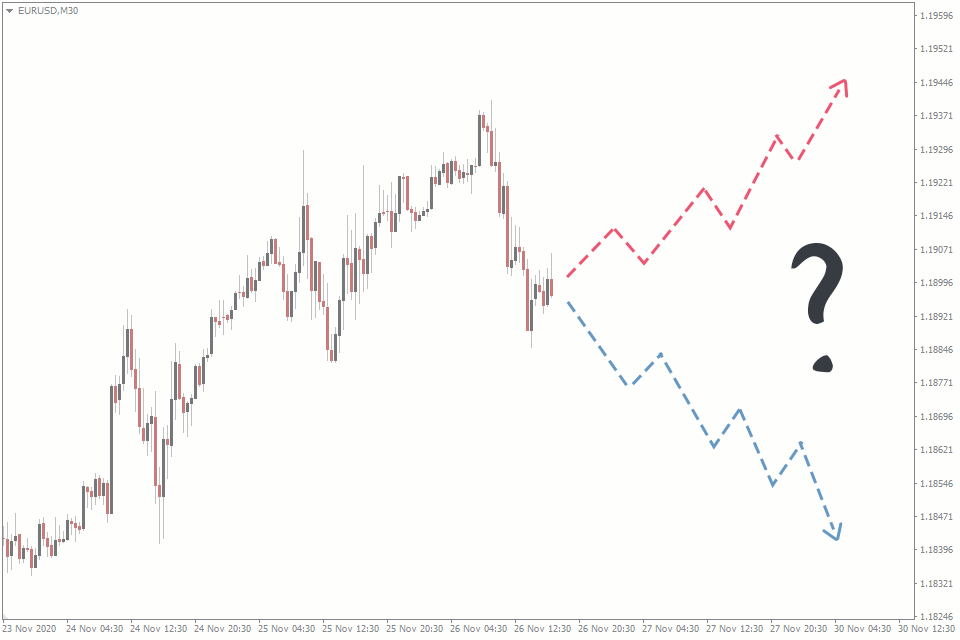
We can see that price was trading within a strong, bullish trend before the latest pullback and for example’s sake let’s just say you were long.
If you could identify whether this latest move was a retracement, you’d expect price to soon resume trading in the direction of the trend and be able to hold onto your winning trade for longer.
On the other hand, if you could identify whether this move was in fact a reversal, you may expect price to continue lower and could therefore close out your long trade while still in profit.
What is a Retracement?
Let’s start by taking a look at retracements.
A retracement is a temporary price movement against the overall trend.
As retracements are only temporary moves, this means that they’re short term, counter-trend moves that always see price trade back in its original direction.
Take a look at an example of a retracement on the AUD/USD hourly chart below:
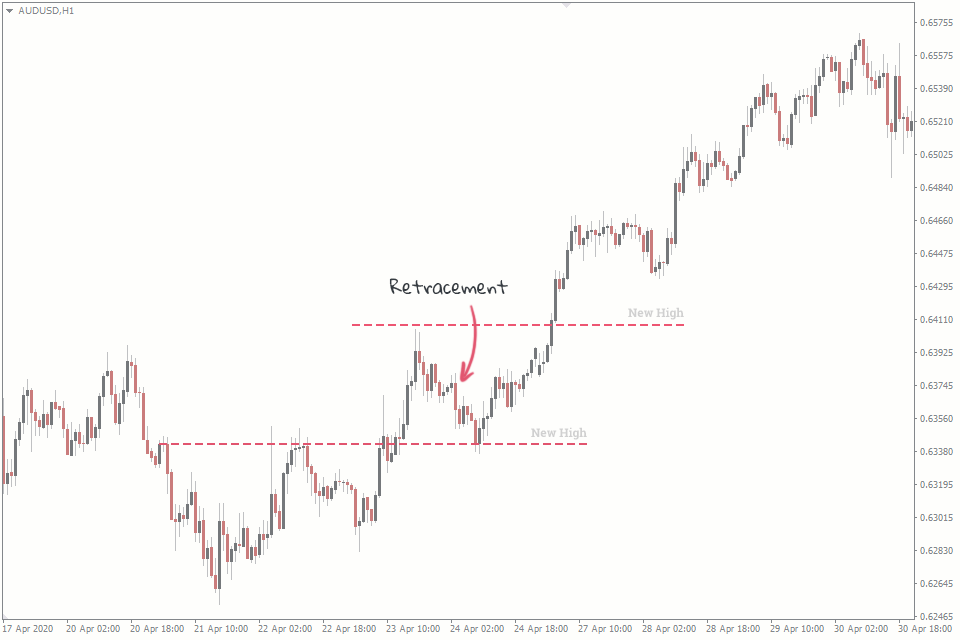
With price trading in a bullish trend, you can see each retracement was a short term, counter-trend move.
Each retracement on the chart was a temporary move and didn’t signal a change in the overall trend from bullish to bearish.
In this particular example, you can see that price retested previous resistance as support each time a retracement occurred.
As long as these support zones were holding, there was no reason to suspect that these retracements indicated a trend reversal was imminent.
What is a Reversal?
Now lets compare the above with a look at reversals.
A reversal is when the overall trend of the market changes direction.
Reversals are viewed as much more significant, longer term changes in direction of a market, flipping from bullish to bearish and vice versa.
If price has reversed in the opposite direction, expect the market to continue on to form a new trend.
Check out an example of a reversal on the AUD/USD hourly chart below:
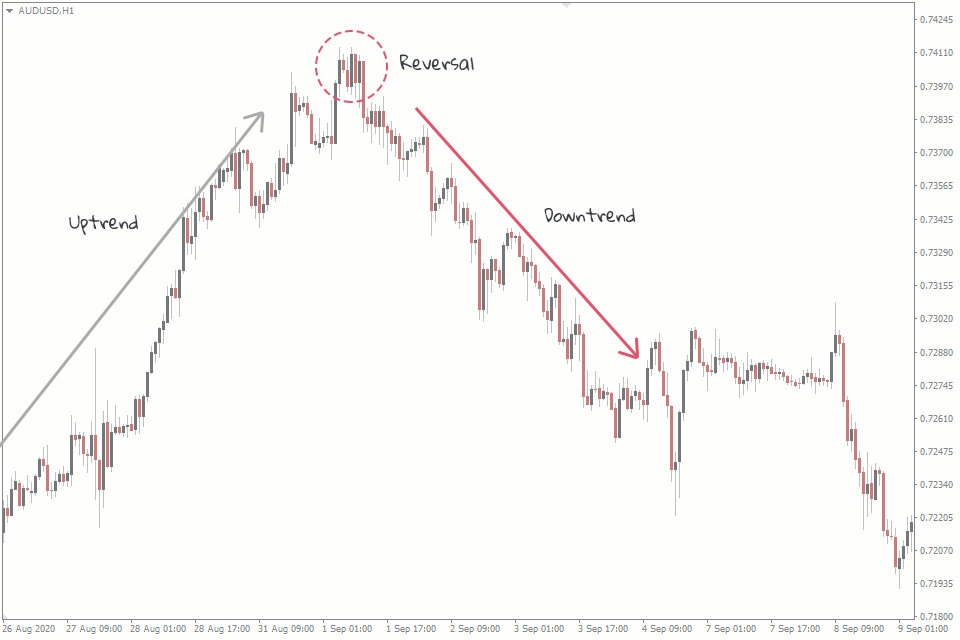
Here you can see that the pullback was in fact a reversal, as the trend changed from a bullish uptrend to a bearish downtrend.
Keep in mind that a reversal would also have occurred if the trend changed from a bearish down trend to a bullish uptrend.
Going back to our example, the reversal at the top of the bullish trend was a false break out of resistance and the catalyst for this switch.
While at the time there was no way to be sure the pullback was going to be a reversal rather than simply a counter-trend retracement, there are signals we can use to shift the odds further in our favour when making our decision.
But before we go over how to identify if a pullback is just a retracement or a reversal, let’s take a look at a summarising table.
Difference Between a Retracement and a Reversal
There are a number of key differences when comparing retracements vs reversals side by side.
The easiest way to visualise the differences, is in a table format such as the following:
| Retracements | Reversals |
|---|---|
| A temporary, counter-trend price movement | A significant trend change |
| A short term move | A long term move |
| Characterised by higher lows and higher highs in an uptrend and lower lows and lower highs in a downtrend | Characterised by candlestick reversal patterns at support/resistance zones such as dojis or double tops |
| Don’t close positions in the direction of the trend | Look to close positions before the trend fully changes |
How to Identify if a Pullback is Just a Retracement or a Reversal
Now that we’ve compared retracements vs reversals, it’s time we discussed how to identify if a pullback is just a retracement, or a full blown reversal.
If you’re able to tell the difference, then you can become a more efficient trader that cuts losses short and allows winners to run.
The true holy grail of forex trading.
With that in mind, let’s now go over some tools and strategies that you can use to quickly identify whether a move may be a retracement or a reversal.
Simple Technical Analysis
The first way to try and identify if a pullback is just a retracement or a full reversal, is to use simple technical analysis.
One of the technical tools available is the humble trend line, an example of which you can see on the EUR/USD 4 hourly chart below:
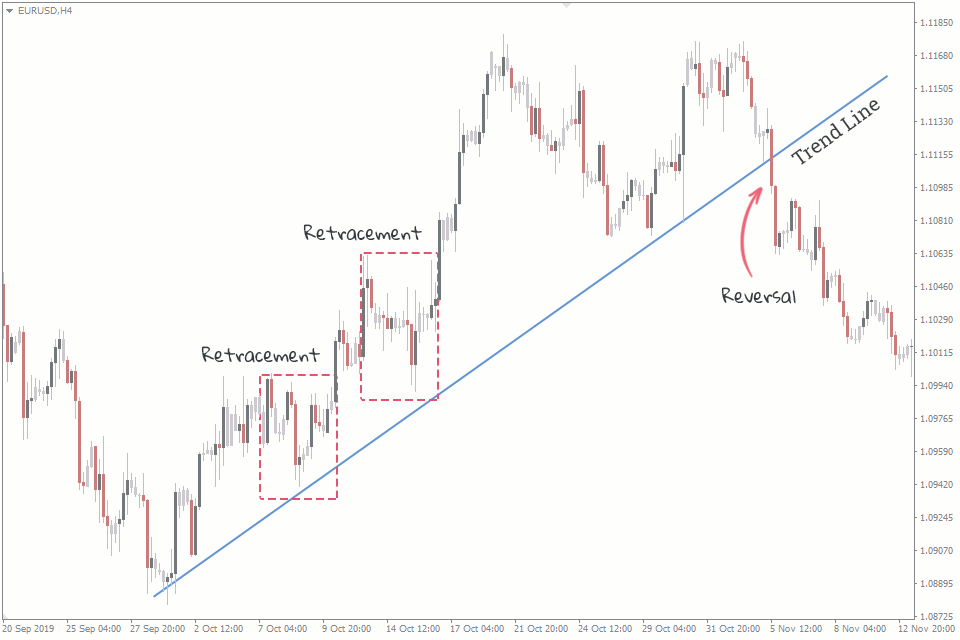
As you can see here, price is in an overall bullish trend.
If price pulls back to the trend line which continues to hold as support, you would be more inclined to view the move as a retracement.
If price goes through trend line support however, you would then use this as a signal to close out your long position, because the move is more likely to be a reversal.
Why bother yourslef with plotting trend lines? Try out auto trend line indicator.
Bull/Bear Sentiment
Our next featured strategy you could use to help identify if a pullback is just a retracement or a full reversal, is to employ the use of profit and positioning ratio indicators.
Take a look at the following EUR/USD hourly chart with the attached FXSSI client positioning indicator for MT4:
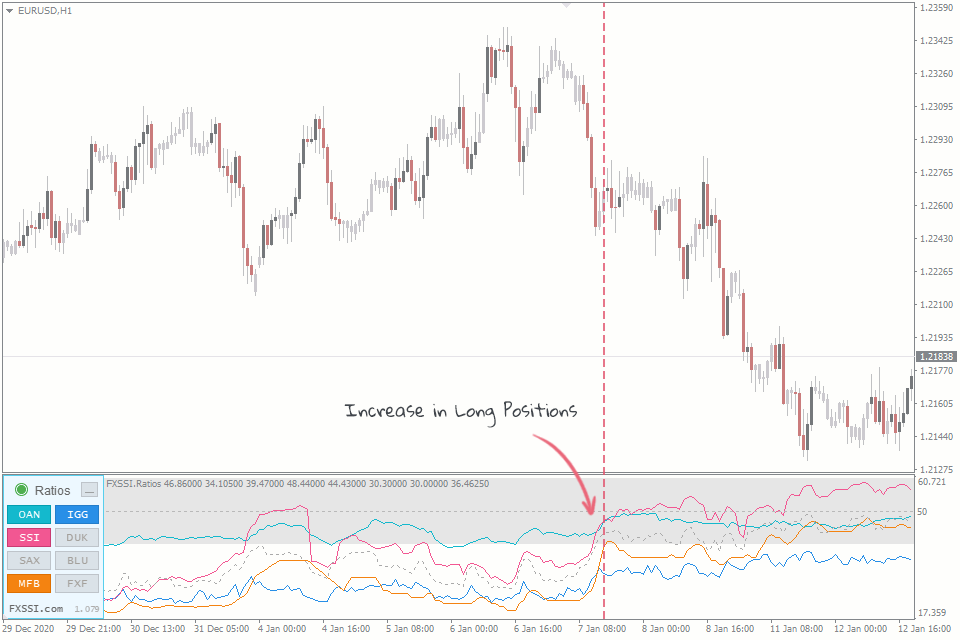
In this case, price had been trading in a bullish trend, before pulling back.
As the pullback developed, you can see that a spike in SSI data here could have been used as an indication of a possible reversal.
Order Book Analysis
Third on our list of tools and strategies to identify whether a move is a retracement or reversal, is to conduct some sentiment analysis via the Order Book indicator.
By analysing order book data from our list of brokers, the indicator is able to help predict a potential reversal even quicker than say a simple trend line.
Take a look at the indicator in action on the following EUR/USD hourly chart:
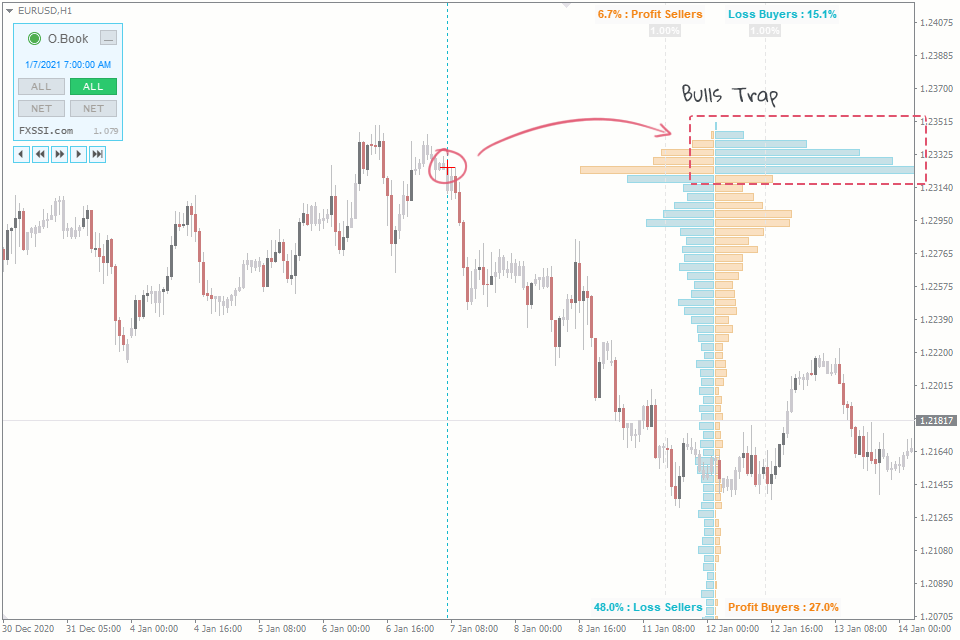
In this case, a bearish reversal was caught right at the top by going to the recent high and seeing a bull trap in the order book.
A strong signal that a reversal is about to occur.
Profit Ratio
Last but not least, we come to the Profit Ratio indicator for MT4.
Take a look at the following GBP/USD hourly chart with the indicator applied:
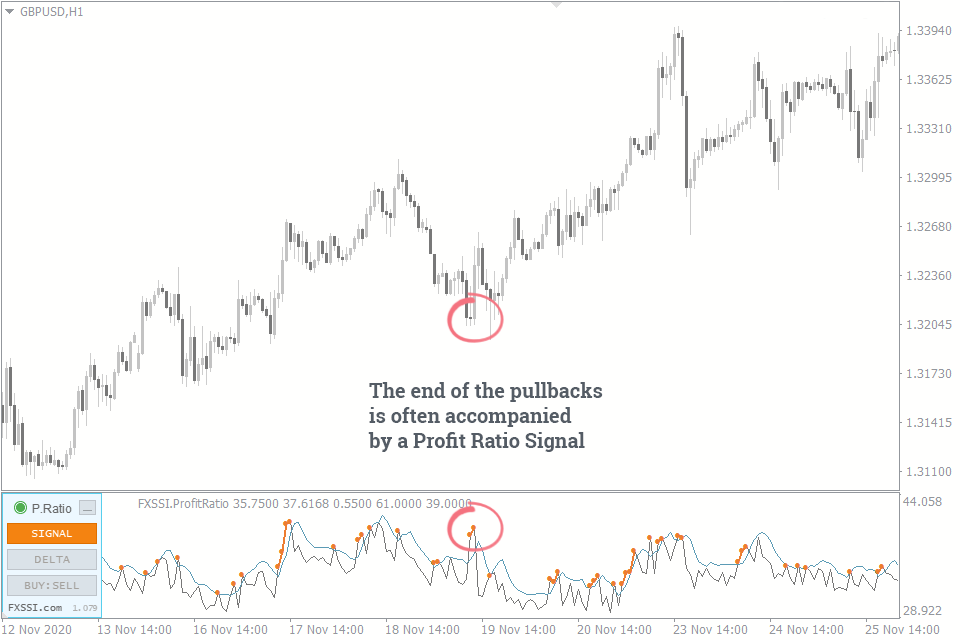
The bullish trend in this example is clear to see, as the pullback is a move slightly lower.
The profit ratio indicator offers insight into whether the move is a retracement, by giving a signal when a counter-trend move may be coming to an end.
In this case, signalling that the pullback was a retracement rather than a full reversal as price continued back in the direction of the overall trend.
Final Thoughts on Retracements vs Reversals
As you can no doubt see, the bottom line is that by learning the difference between retracements and reversals, you’re able to make better trading decisions.
Ultimately this leads to a higher win rate, better risk:reward ratios and finally the opportunity to make more money.