How to Profit From Trading Pullbacks in Forex
Pullbacks occur all the time in Forex. Ultimately, price could be ascending, descending, or moving sideways. But the pullback is always there.


Pullbacks help Forex traders enter positions at better price levels. In an uptrend, for instance, a trader who is looking to buy a currency pair wants to make the trade at the lowest price possible. So, they wait for the price to pullback before they enter their trade.
Now, the question on your mind might be, “how do I trade Forex pullbacks?”. The answer to your question starts with knowing how to spot pullbacks. How do you know when the currency pair is merely doing a pullback and not reverting to the opposite trend?
This article explains the strategies for trading pullbacks in Forex. There are several ways to identify pullbacks on charts. Some of them are described below.
1. Pullbacks After a Breakout
You will find these pullbacks when the market is breaking out of a consolidation. Something similar also happens during a trend reversal.
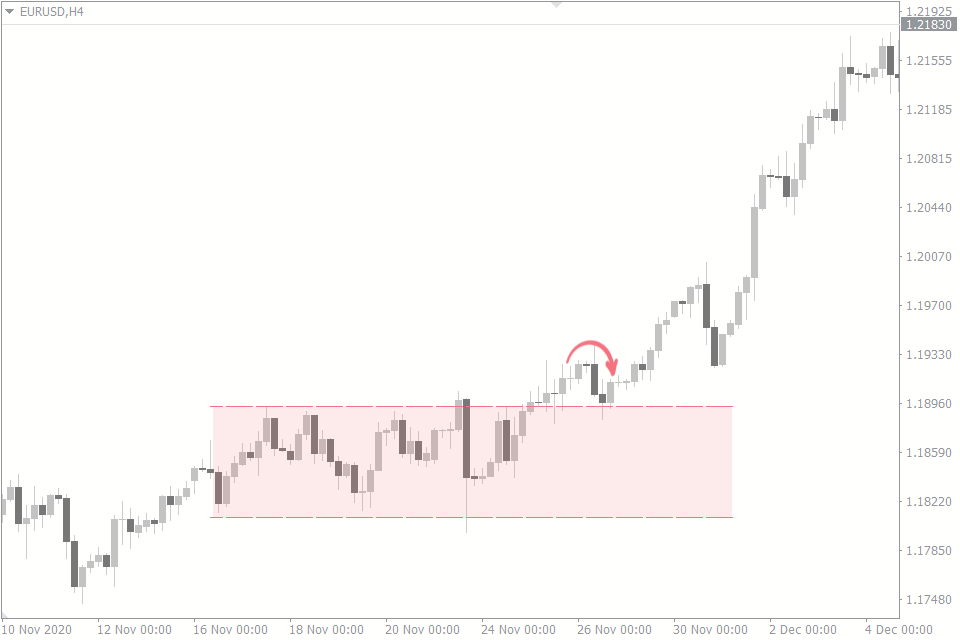
In the image below, you’ll see that the price was consolidating, horizontally zigzagging between support and resistance. But when price breaks out of the resistance, price doesn't go very far before it comes back to the previous resistance (which now becomes support). That is a pullback.
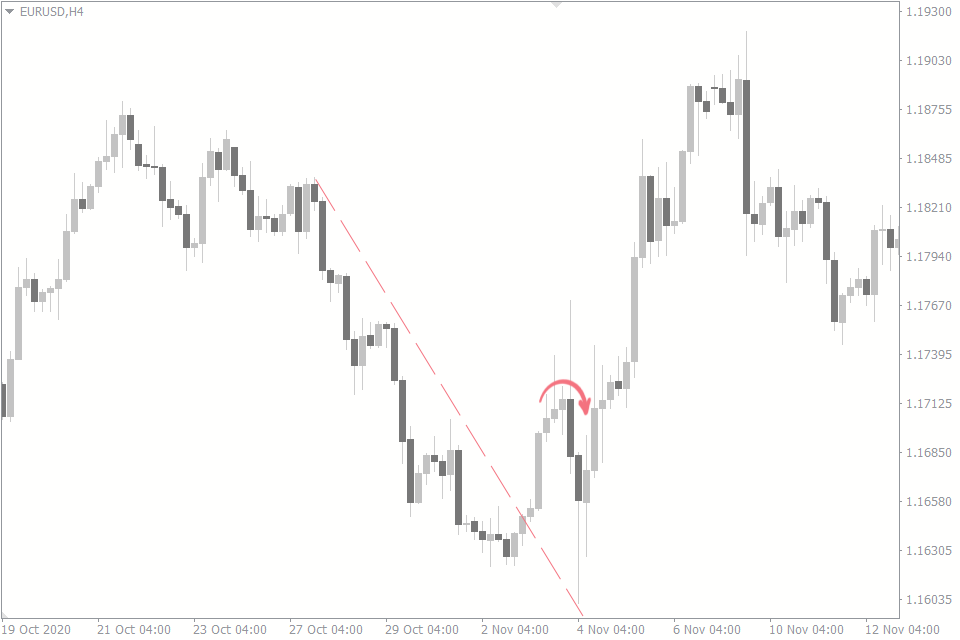
In the trend reversal image below, you’ll see that price also pulled back a little after the reversal before continuing on its journey.
Apart from the pullback strategy, check out other ways to take advantage of Forex breakouts.
2. Pullbacks on Trendlines
Trendlines in Forex are impossible without pullbacks. A trendline forms when price hits a line three times or more. You may connect two points on your chart, but you couldn't say they form a trendline until the market pulls back to touch the line once again. Only then can you call it a trendline. If this confuses you, this article on how to recognize trendlines in Forex will be helpful.
Take a look at the descending trendline in the image below to see how price keeps pulling back to the trendline.
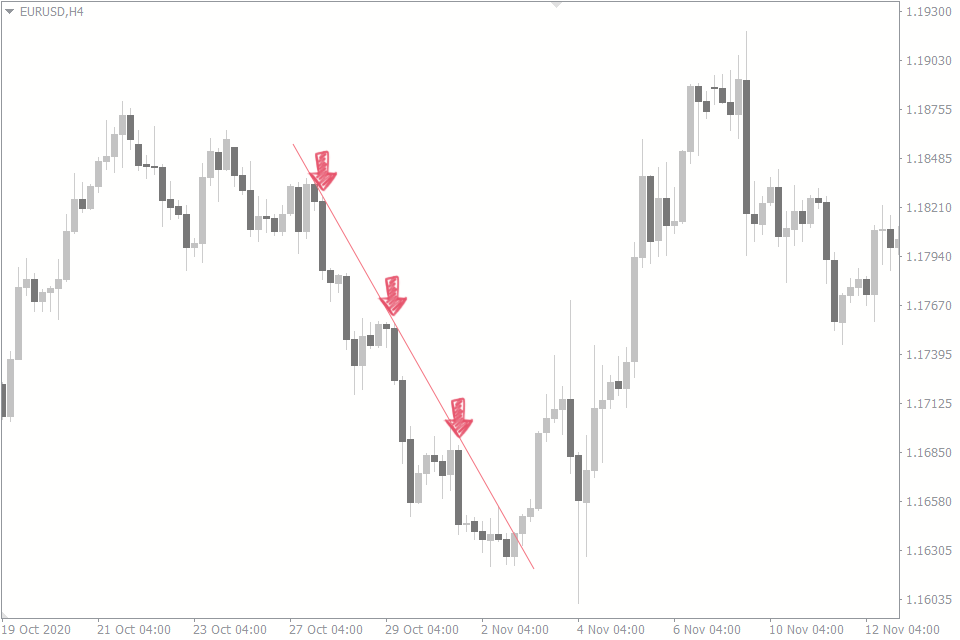
There is a disadvantage to waiting for pullbacks on major trends, however. The disadvantage is that these pullbacks may take a long time to validate. And in the time it takes for a pullback to occur, a trader may have missed a lot of trading opportunities.
3. Pullbacks on Indicators
Indicators are also useful methods of spotting pullbacks on the Forex charts, especially if the indicators are reliable. These three indicators are great for trading pullbacks in Forex.
The Moving Average
It doesn't matter what moving average period you use. It could be a 20, 50, or 100. You’ll find out that price keeps hitting the moving average line and bounces back. However, lower periods are liable to false breakouts and false signals. So, a trader has to be careful when using lower timeframes.
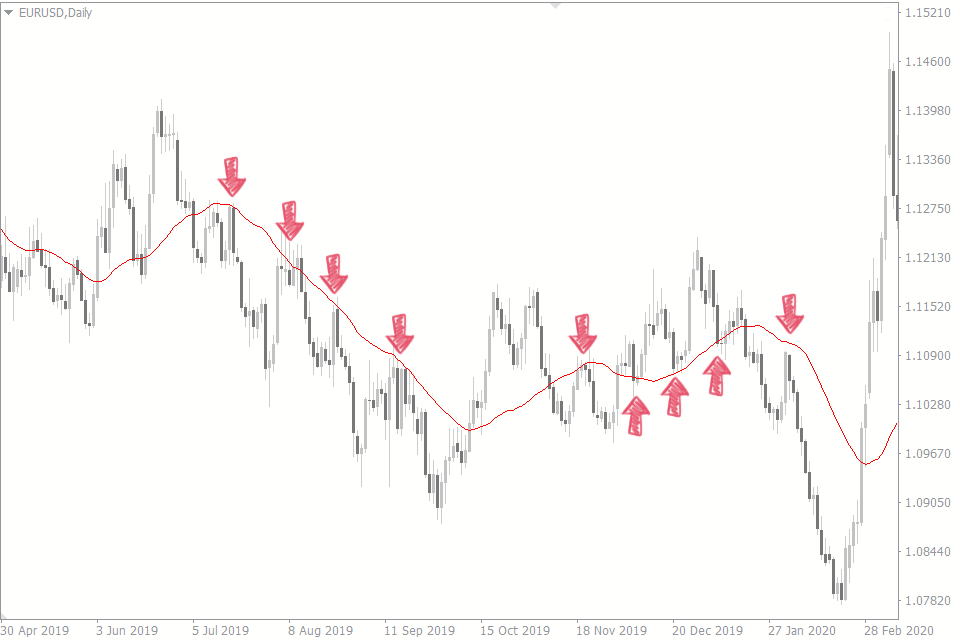
The moving average in the image above is a 30-period moving average. As you can see, the price pulls back to the moving average and bounces back on several occasions.
Stop Loss Cluster Indicator
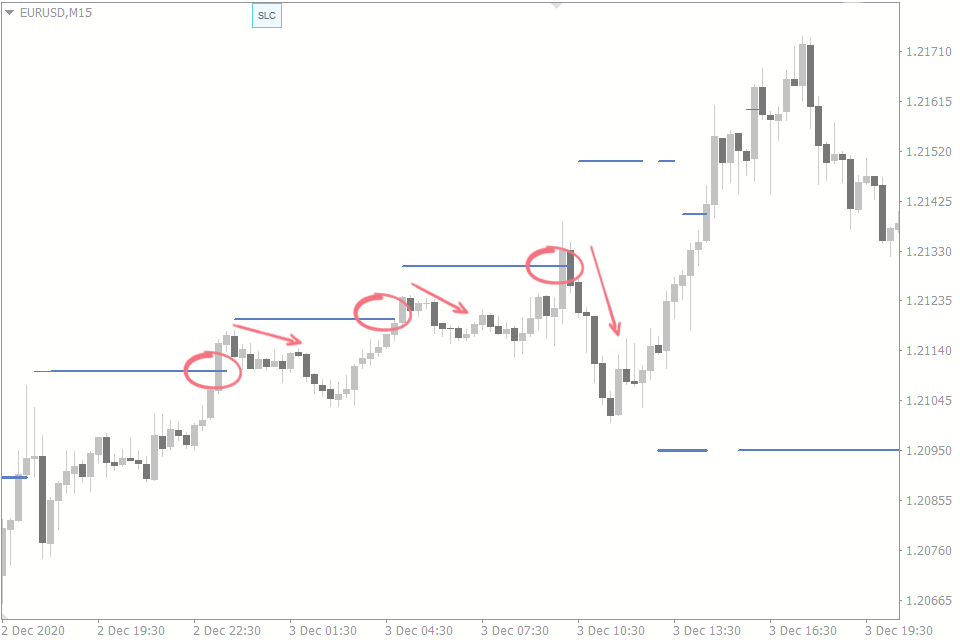
Another indicator that works well in predicting the start of a pullback is the FXSSI Stop Loss Cluster Indicator. This indicator gathers stop loss information on a currency pair and shows where they form a cluster on your chart. The way this indicator suggests pullbacks is that price tends to trigger the stop losses before a pullback starts.
In the image below, the stop loss clusters are shown as the blue lines on the chart. See how pullbacks occur soon after the stop loss clusters get triggered.
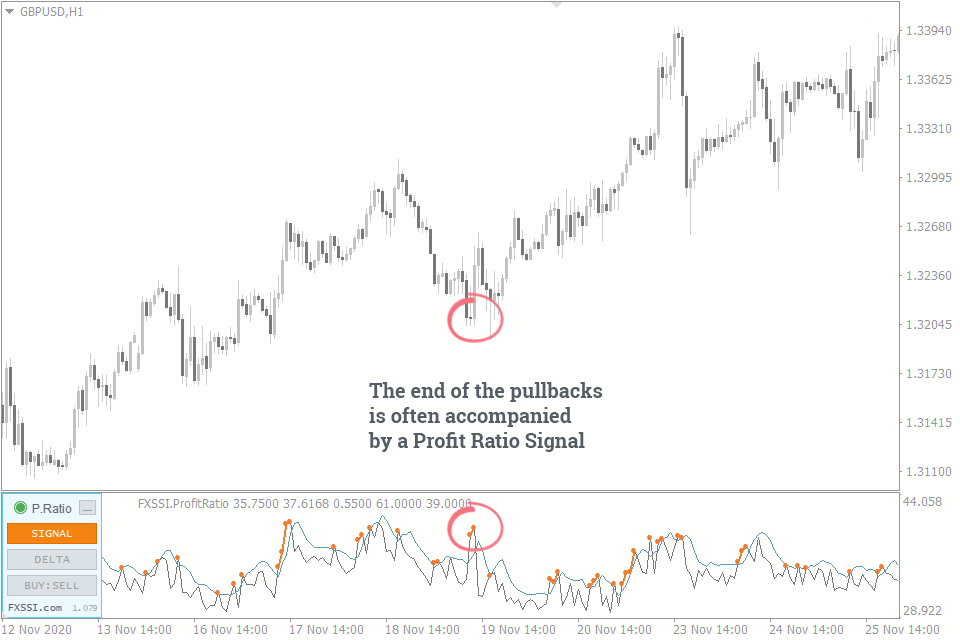
Profit Ratio Indicator
The Profit Ratio indicator is another tool that predicts the end of a pullback well. In the image below, the profit ratio indicator gives its signals, and the pullback ends around the same time.
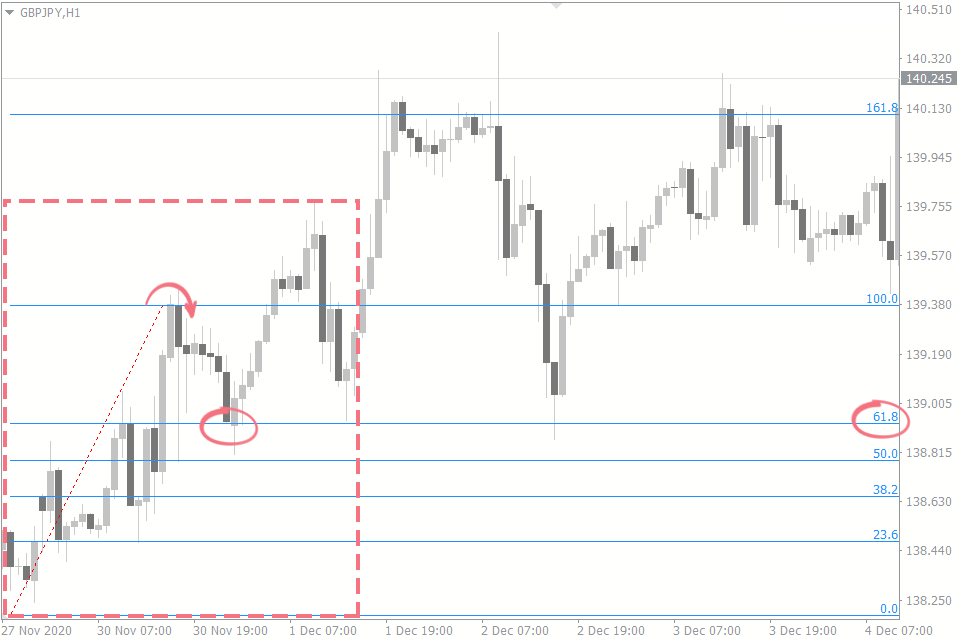
4. Pullbacks on the Fibonacci Retracement Tool
The Fibonacci retracement tool is one of the most useful tools for the forex pullback strategy. The Fibonacci has lines or levels where price ends pullbacks.
On an uptrend, for instance, draw your Fibonacci from the latest low and end it on the most recent high. This way, the 100.0 level of the Fibonacci is on the most recent high. The levels between these two points are the likely places where pullbacks may occur. Of these levels, the 61.8, 50.0, and 38.2 are the most common.
Pullback Trade Entries
Trading pullbacks in Forex is very simple. The basic idea is to wait for the pullback to end before entering a position in the direction of the major trend.
A trader could make an aggressive entry at the end of the pullback. This trade entry method helps the trader get lower risks and higher rewards. However, this method still has some risks, as price may not recover from the pullback and keep going further to hit your stop loss.
You could also make a conservative entry when price returns to the most recent high or low before the pullback began. Although you may expect a lesser reward than that of an aggressive trade entry, this method is safer. The market has already made its bias known, and you would only be trading in that direction.
Pullback trading strategies are just a part of several ways to approach the Forex market. You can check out other ways to improve your Forex trading with FXSSI trading tips.