How to use Pivot Points? Trading Strategies
In this article, we will focus on the main Pivot Point trading strategies. But first, let's figure out what pivot points are.


Pivot points (PP) are price levels that are calculated using a specific formula, in which the data on previous prices are used.
Purpose. Pivot points are used by Forex traders to suggest whether the market is bullish or bearish. Typically, traders use pivot points calculated at yesterday's prices to make trading decisions today.
Pivot points strategy. Simple example
The chart below shows a simple trend following Pivot Point strategy in use. In this case, we consider Forex EUR/USD intraday chart, H1.
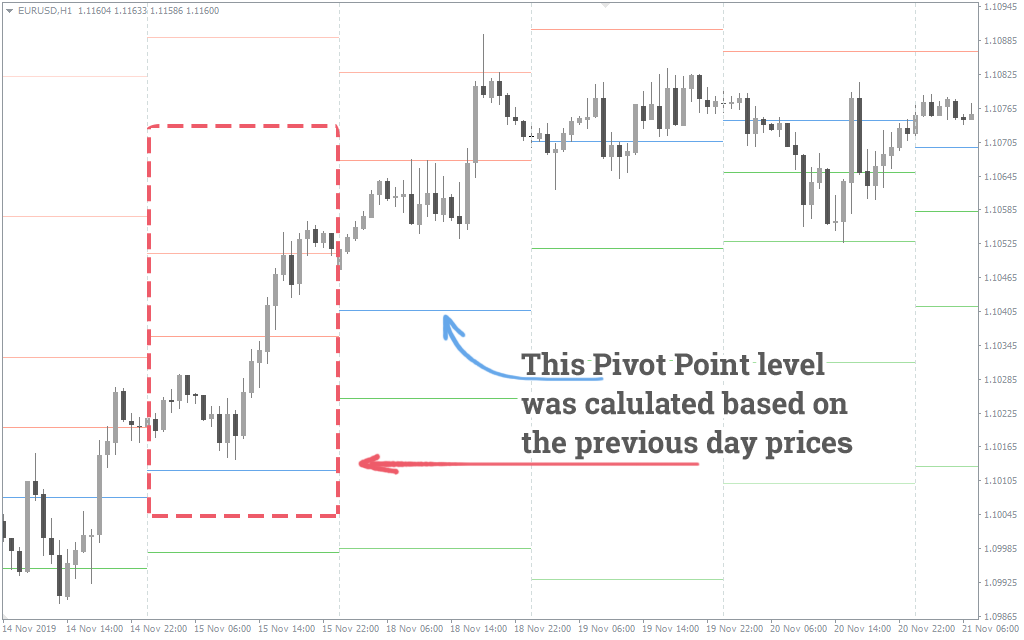
Here we can see how Pivot Points indicator used the data for November 15 (Friday) to calculate the level of the pivot point for November 18 (Monday). The indicator plots PP on the chart as a green line.
How to use pivot? Let's say you are a trader who plans to use Pivot Points for trading. You see that on November 18 the price opened higher than the PP (green line). This means that in your daytrading, the opening of Long positions will take precedence.
If you find the day opening price below the pivot point, then Short positions are preferred.
So, you see that the Pivot trading strategy is pretty simple.
Support and Resistance Levels
The formula for pivot point calculating also provides the levels of support and resistance. On the chart above they are also available:
- the four red lines above the pivot point are the resistance levels;
- the four blue lines below the pivot point are the support levels.
And by the way, pay attention to how accurately the two resistance levels worked during the November 18 trading session (see the picture above).
Pivot Point Formula
There are several approaches for calculating the Pivot Point levels. They use slightly different formulas. But the results of the calculations are quite similar.
Here is the Classical approach for calculating the Pivot Point (PP), Resistance (R) and Support (S) levels:
- Pivot Point (PP) = (H + L + C) / 3
- R1 = (2 × PP) – L
- R2 = PP + H – L
- R3 = H + 2 × (PP – L)
- S1 = (2 × PP) – H
- S2 = PP – H + L
- S3 = L – 2 × (H – PP)
The other systems used for calculating the pivot points include Fibonacci, Camarilla, Woodie's, De Mark's. The table below displays the results of calculating pivot points and S/R levels using those formulas:
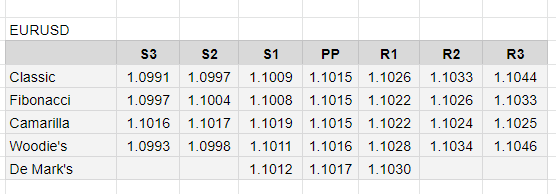
We will not go into the details of the calculations here. But if you require more information on all methods, the formulas are described here: PivotPoints.All-In-One
Note that the difference in the results in the table is negligible. So if you prefer to use the Fibonacci pivot points strategy in Forex trading, the results will not fundamentally change if you switch to Tom De Mark’s formula.
The biggest difference is provided by the Camarilla pivots. If you are unsatisfied with the classic calculations, switch to the pivot point trading strategy based on Camarilla formula.
Timeframes for using Pivot Points
There are several timeframes used for pivot point strategies.
As we already said, usually Forex traders use Pivot Points for intraday trading. To do this, they use the previous day price data.
If you want to trade the weekly pivot point strategy, then you should calculate pivot points for the current week based on the prices of the previous week.
The same rule works for the monthly trading strategy, but with monthly period respectively.
Short-term speculators can calculate pivot points every hour.
Pivot Point Trading Strategies
There is a huge number of techniques based on pivot points, too many for just one post. So we will describe only a few of the widely used.
The basic idea beneath pivot points trading strategies is that price tends to interact with lines of PP, S, and R.
So, common logic can be described as follows:
- if price reverses up from any line, the trader can assume that it will reach at least the next line above;
- if the price breaks out through any line, the trader can assume that it will reach at least the next line above;
- if price reverses down from any line, the trader can assume that it will reach at least the next line below;
- if the price breaks down through any line, the trader can assume that it will reach at least the next line below.
Now, let’s get to the specific pivot trading strategies.
Keep in mind that you can test them to find the best one for you, modify the rules if needed or add your favorite indicators for more information. As we all know, trading is a kind of creativity, and pivot points as a part of it are not an exception.
Classic pivot point trading strategy
This pivot point strategy is the most popular. In fact, we have already mentioned it in the very beginning of this article.
But now we’ll get closer to the details. Let us assume, that on November 25 price opened above the pivot point (green line). This means you should prefer buying. Then you wait for the price to fall to the green line.
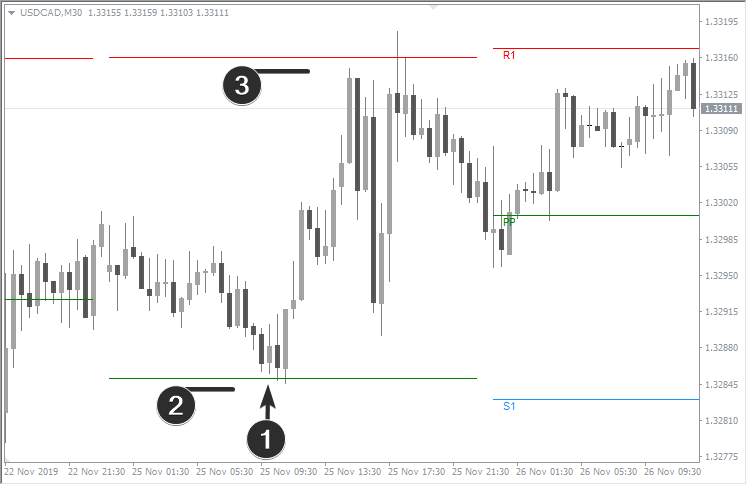
- When you see a bullish candle that pushes off a pivot point, you can open long position;
- Place a stop-loss just below the pivot point;
- Set your take-profit slightly below the first resistance level.
The Risk: Reward ratio should be at least 1:2.
Tip: Find out how you can improve your stop-loss placing technique in this article.
Similarly, you can use pivot points for short positions. When you see that the price opens below the pivot point, wait for it to rise to the green line.
- Open Short trade when a bear candle pushes off the pivot point;
- Place stop-loss above the pivot point;
- Place take-profit just above the first support.
Tip: You can close by take-profit not the entire position, but only a part of it. The trend might continue, and you can increase your profit.
If the trading session ends, and the price has not reached either take-profit or stop-loss orders, you can choose one of the following options:
- Close a trade at the current price, and open a new trade next day using new pivot points;
- Wait until the price reaches one of the levels to exit the trade.
There are no clear rules here, you can use additional indicators to make a decision.
How to trade the news using pivot points
The news release means increased volatility. Forex traders should always be aware of upcoming events so that wide candles won’t be a surprise for them.
Our Forex News Indicator will help you to prepare for news releases.
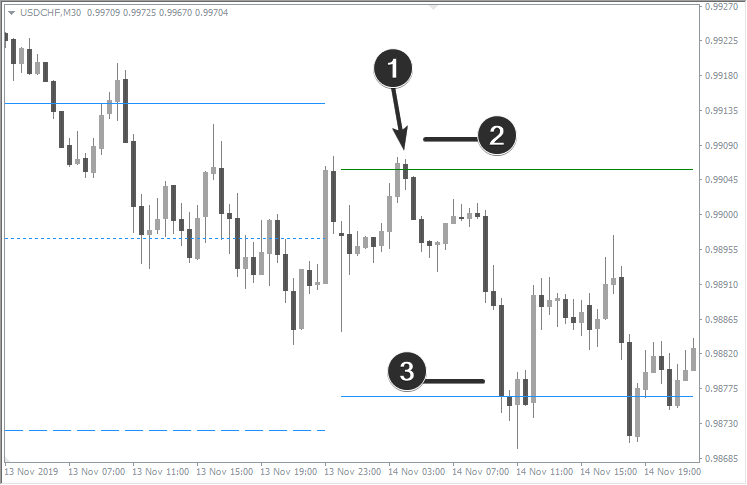
As we see in the example, the day opened below the pivot point. This was a bearish signal. However, important news was released that day.
In the moment of the violent reaction to the news, a wide candle was able to reach the first resistance level.
This situation can be used as a short trading setup.
More precisely, we look for the entry point on the M1 timeframe. This ultra-fast timeframe is the most suitable for trading during the news events:
- This is our trade entry point;
- Place stop-loss above the nearest resistance level;
- Place the first take-profit above PP (green line);
- Place the second take-profit above the first support level.
Note: Trading the news involves increased risks. Practice well before trying this trading strategy on a live account.
Trading against the trend using pivot points
Trading against the trend also carries increased risks. But there is an advantage of higher profit potential.
The example below describes how to use pivot points when dealing against the trend.
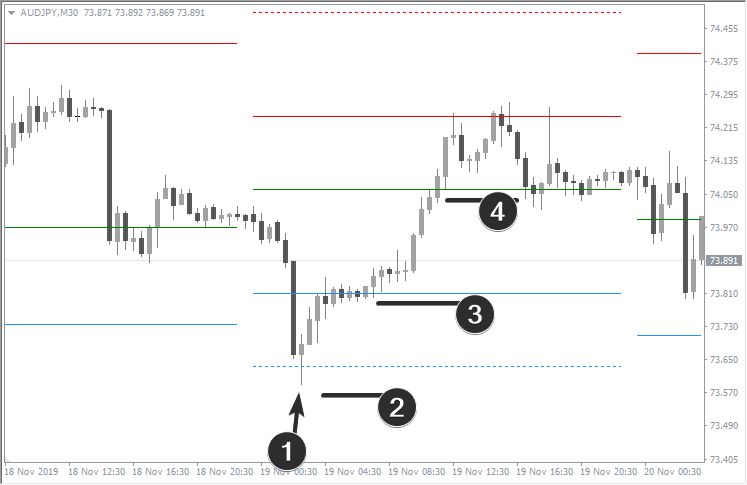
The market opened below the pivot point. This means the trend is most likely downward. However, see what happened next:
- Candlestick with a long lower shadow is formed on the chart. Remarkably, price bounced off the support level. This can be used as a long trading setup;
- In this particular situation, it is logical to place a stop-loss below the support level;
- The first take-profit is just below the upper support level;
- The second take-profit is just below the pivot point.
How to trade a breakdown
The “Breakdown” strategy is more suitable for trending instruments.
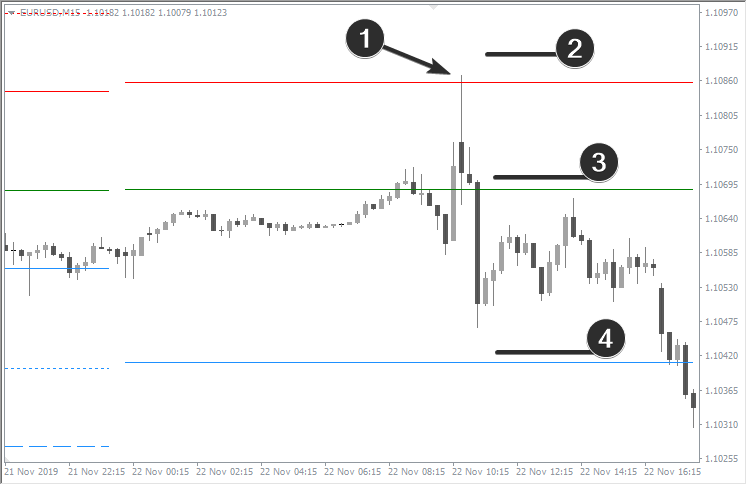
In this example, the EUR/USD pair opened significantly above the pivot point.
Moreover, the price confidently kept at a considerable distance above the green line, several times trying to break through the first resistance level. The trader can assume that the market is really strong and should plan a breakout above resistance to catch a bullish trend:
- The trader enters long when the candle closes above the first resistance;
- Stop-loss should be placed below the first resistance;
- Take-profit should be placed below the second resistance.
Tip: The reverse pivot point strategy can be applied to trade the support breakdown while the market is bearish.
How to trade flat markets using pivot points
Quite often, markets go sideways. The trend is either absent or not clearly defined. In such cases, the opening price of a new day is close to the pivot point. Then, during the day, the price fluctuates around the pivot point, not going far from it. This is typical behavior for a non-trending day. How to trade in such a market using pivot points?
If a trader determines that the market is flatting, it is acceptable to trade reversals.
General rules for Long trade:
- Open position near support line;
- Place take-profit at pivot point;
- Place stop-loss below the support level.
General rules for Short trade:
- Open position near resistance line;
- Place take-profit at pivot point;
- Place stop-loss above the resistance level.
The example below shows the day opened close to PP and fluctuated around it.
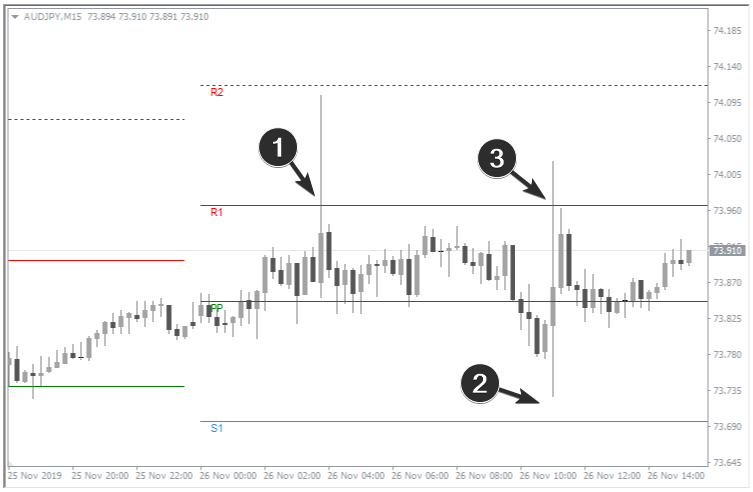
How to trade pivot points in this case:
- This movement is too aggressive, the risks are increased;
- Here the price did not reach the first support line, the setup was not formed;
- There is a reversal from resistance. It is not as aggressive as point 1. A more accurate short entry can be found on M1-M5 timeframes. Place take-profit near the pivot point.
How to Improve Pivot Point Trading Strategy
Sometimes trading pivots can be confusing. But our indicators will help you deal with any uncertainties.
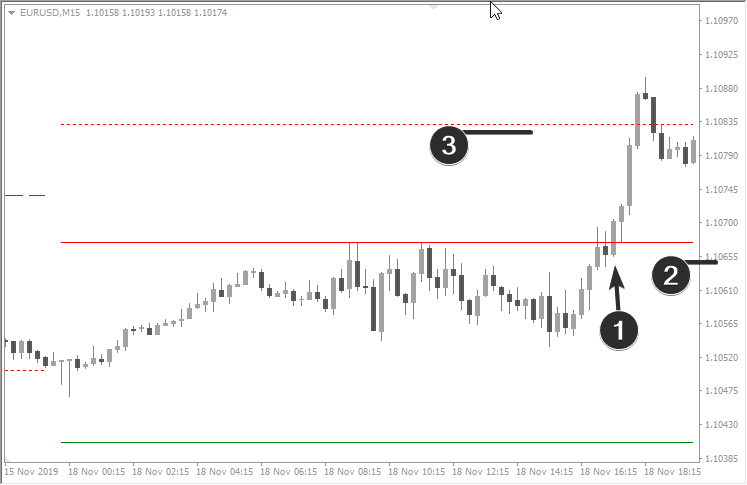
Let’s analyze a specific situation (refer to the chart below).
- From a bearish point of view, we have a candle with a long upper shadow. It crosses the resistance line and closes below it. This is a sign of weakness.
- But from a bullish point of view, the market opened above the pivot point (not visible on the chart). This indicates that buying takes precedence.
We have conflicting opinions. How to act?
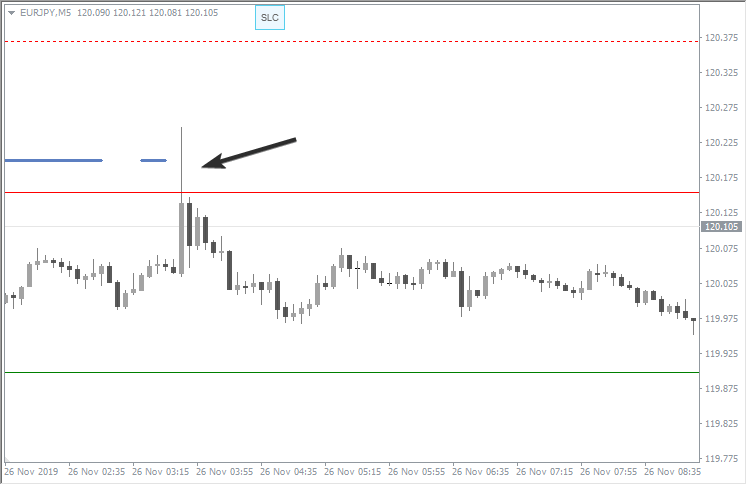
In this case, the Stop-Loss-Clusters indicator will be helpful. This indicator displays a blue line on the chart, which shows that sellers’ stop-losses concentrate at that particular level. Having activated the cluster of sellers’ stop-losses, the market tends to turn down.
Therefore, it makes sense to open a short position when the long upper shadow closes below the resistance. You may place the stop-loss above the resistance level, and take-profit – above the pivot point.
Advantages and disadvantages of pivot point trading
Pros:
- Simple formula;
- Pivot points are static: they do not change during the day, which is suitable for those who like certainty;
- Allows to measure the endless space of Forex charts;
- Easy to use, allow you to build strategies with clear rules;
- Help to keep trend movements.
Cons:
- Pivots provide low accuracy. The chart below shows an almost perfect setup for opening a short position. But such setups can happen once a month.
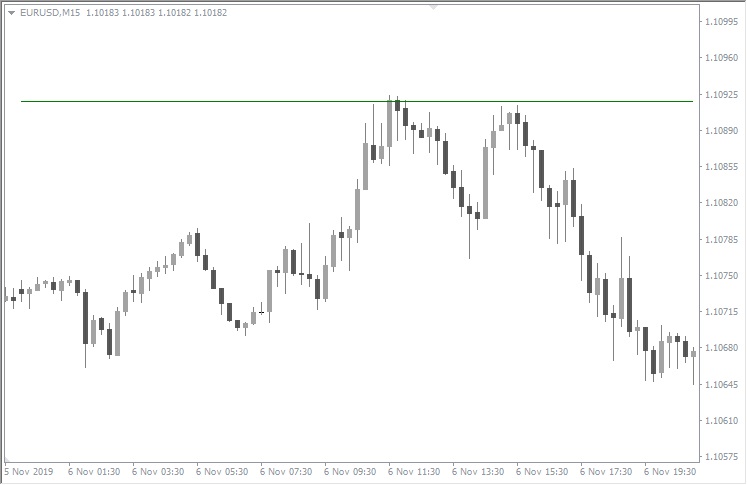
In many other cases, the price may cross the pivot point back and forth several times. The strict compliance with the rules becomes difficult, as observing the growing losses causes stress for the trader.
We advise you to always keep your emotions in check, and better find additional confirmations while trading with pivot points.
Summary
Try to use the pivot trading strategy in combination with other FXSSI indicators.
For example, if:
- FXSSI Current Ratio shows a bearish sentiment,
- and the price opens below the pivot point…
…then you will have more confidence in opening short positions.
As we have already stated, trading is about creativity. We hope that FXSSI indicators will help you create your effective pivot point trading strategy and achieve success in Forex.