
How to Profit From Trading Pullbacks in Forex
Pullbacks occur all the time in Forex. Ultimately, price could be ascending, descending, or moving sideways. But the pullback is always there.
Pullbacks occur all the time in Forex. Ultimately, price could be ascending, descending, or moving sideways. But the pullback is always there.
2020 has been anything but a stable year. With the growing political and economic uncertainty, gold has become a popular investment option for many people looking for ways to reduce risks and diversify their portfolios.
When you trade a currency pair in forex, you are not buying or selling the individual currencies. You are only speculating on their future exchange rates and hope to make profits when they move in the direction of your speculation.

There are many tools and information reports on the internet on which forex traders can make their trades. Some of those tools are useful enough to conveniently include in your trading strategy. One of such tools is the COT report.

The Forex market always moves in patterns. This makes sense when you consider how price has and will only move in one of two directions: up or down.
Forex traders are now asking whether carry trading in 2023 remains a viable trading strategy, or if we should consign it to history.
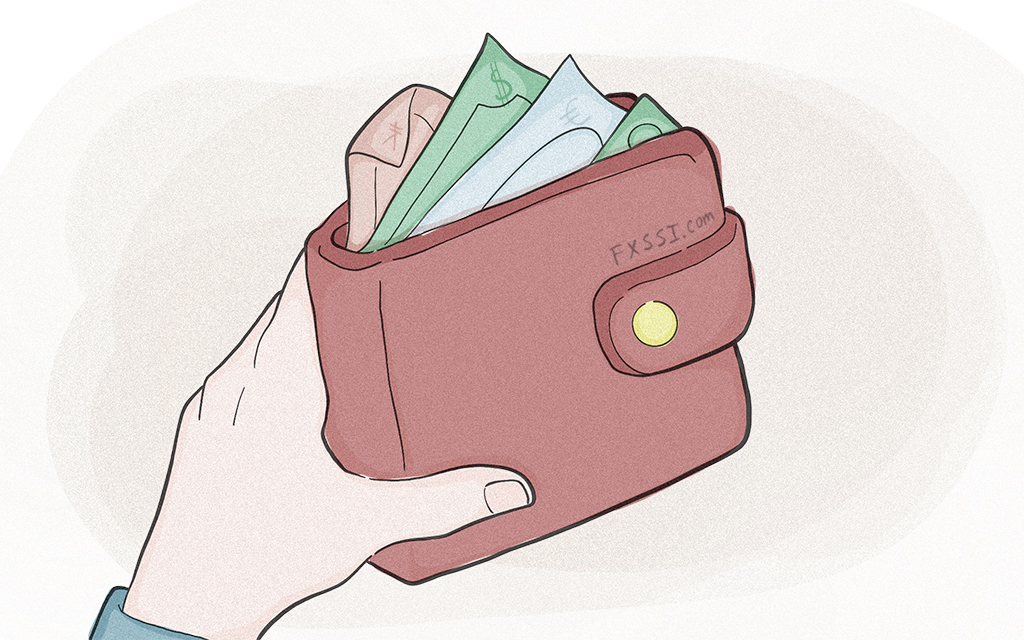
Investing is always a great way of generating additional profit. The ever-changing world we live in today gives us plenty of investment opportunities – stocks, real estate, commodities, gold, and even art. What about currencies though?

What does “stable money” mean? Simply put, a stable currency is the one, which holds its exchange rates, i.e. its rates do not fluctuate too much over time. So, most stable currencies aren’t necessarily the most powerful or expensive.
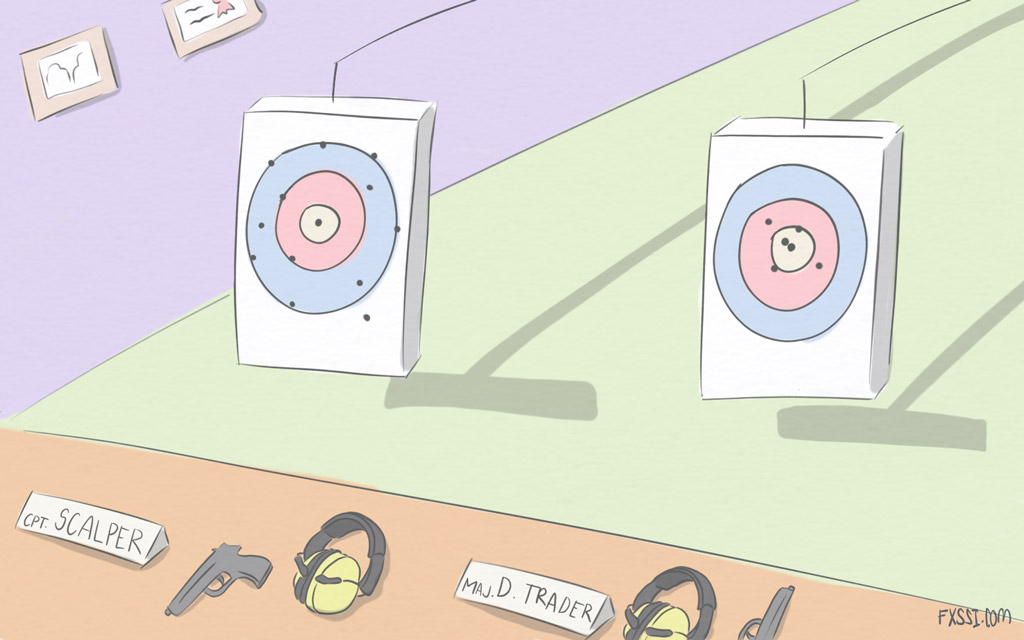
If you are a forex trader, you probably fall into the category of either scalp trader or day trader. The line that distinguishes the difference between a day trader and a scalp trader is a blurry one.
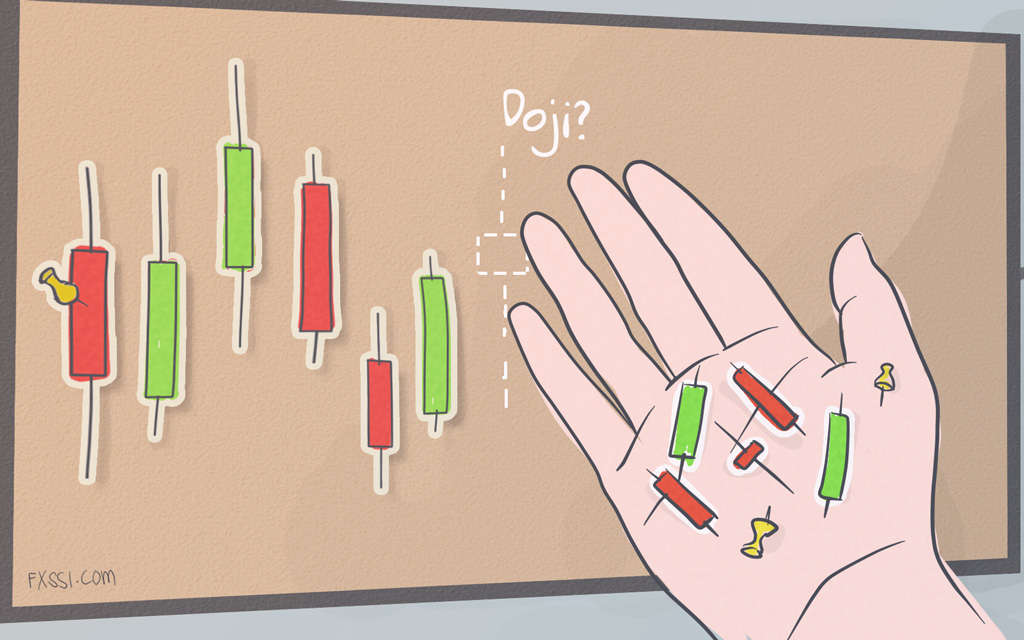
Japanese candlesticks often form patterns that predict future price movements. Some of them predict bullish price movements, and others suggest bearish price movements. They may appear as single, two, or three candlestick patterns.