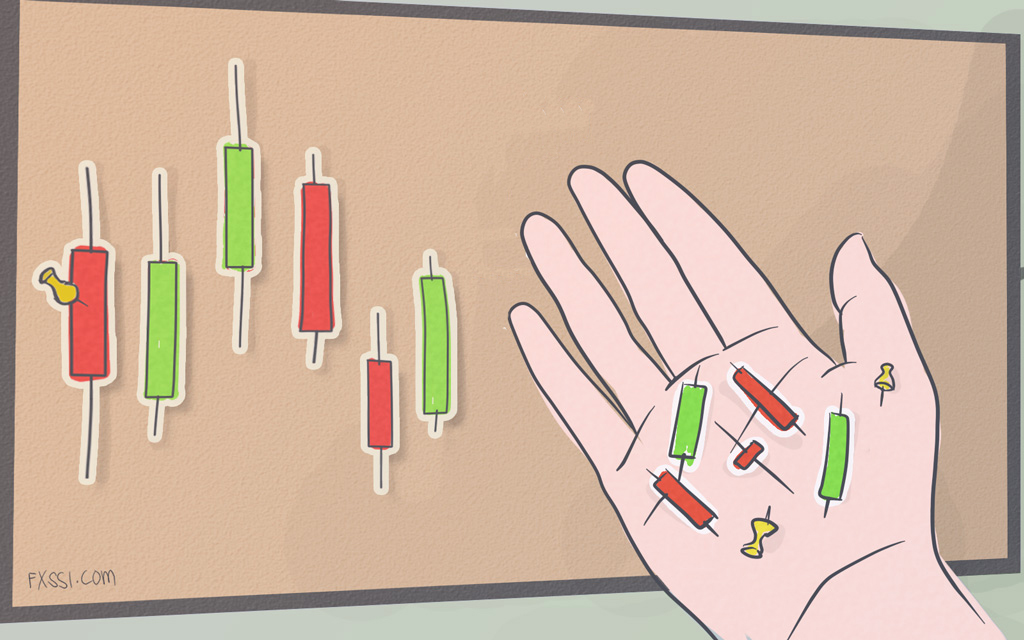

Trading the Outside Bar Candlestick Pattern
Candlestick patterns are great tools to improve your forex trading experience.
Candlestick patterns are great tools to improve your forex trading experience.
Developed in the 1950s by George Lane, the stochastic indicator has grown to be one of the most popular indicators today.
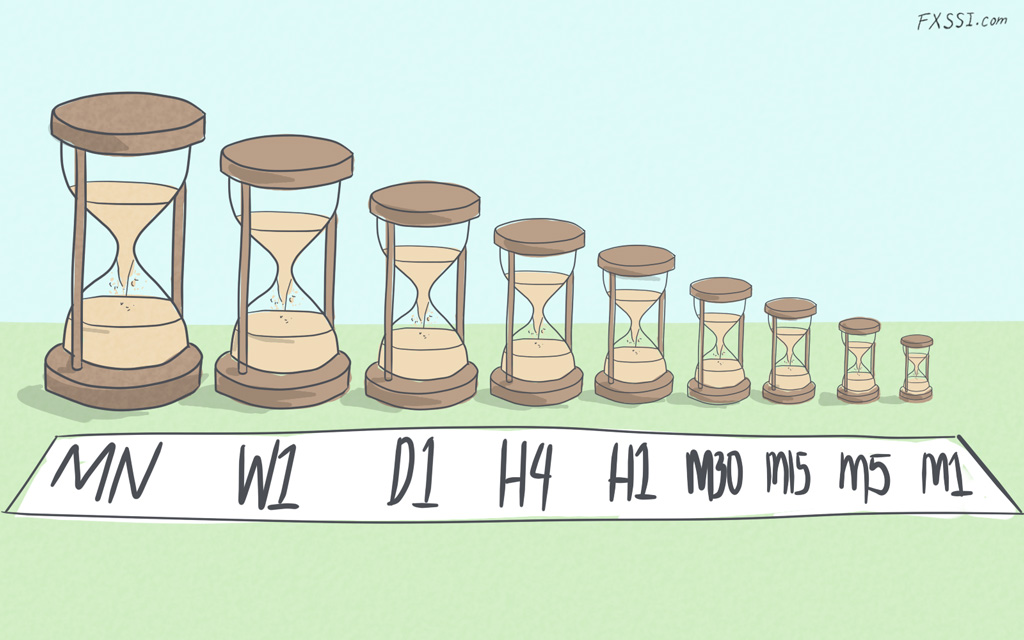
There’s been a lot of buzz about multi timeframe analysis lately, but what exactly is this type of technical analysis and why should you incorporate it into your forex trading strategy?
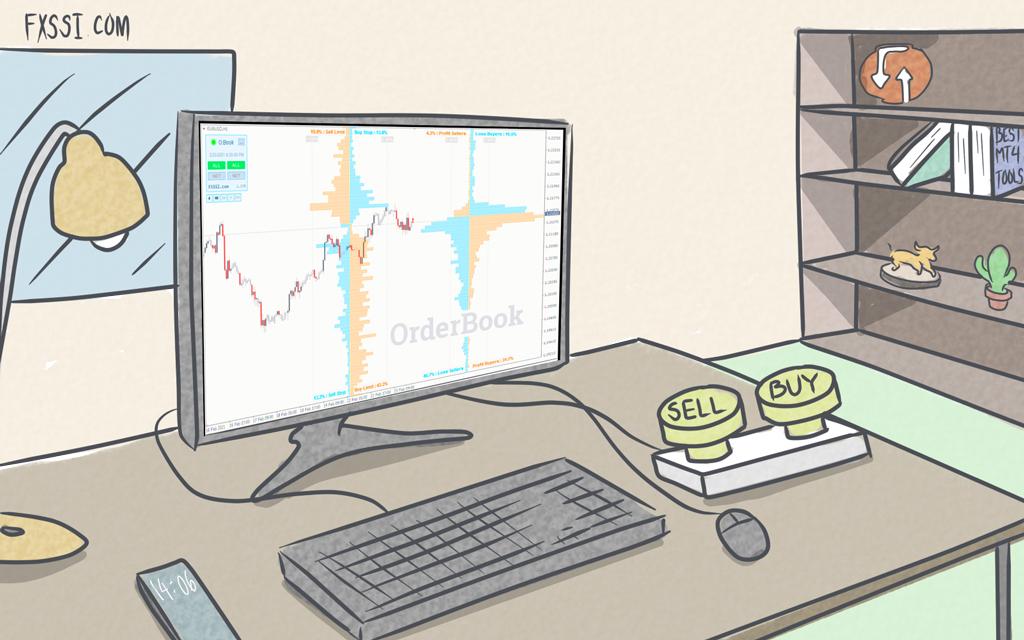
Have you ever seen the market bounce hard off a key level, but the trend is still overwhelmingly against the bounce?
One of the biggest issues new day traders face in Forex is a lack of strategy. It’s all too easy to get caught up in every little move on every pair, but when trading by the seat of your pants, eventually you’ll be caught with your pants down.

The rectangle pattern forms when parallel support and resistance levels cover the price at the top and at the bottom. You'll often find this pattern during consolidation in trending markets.
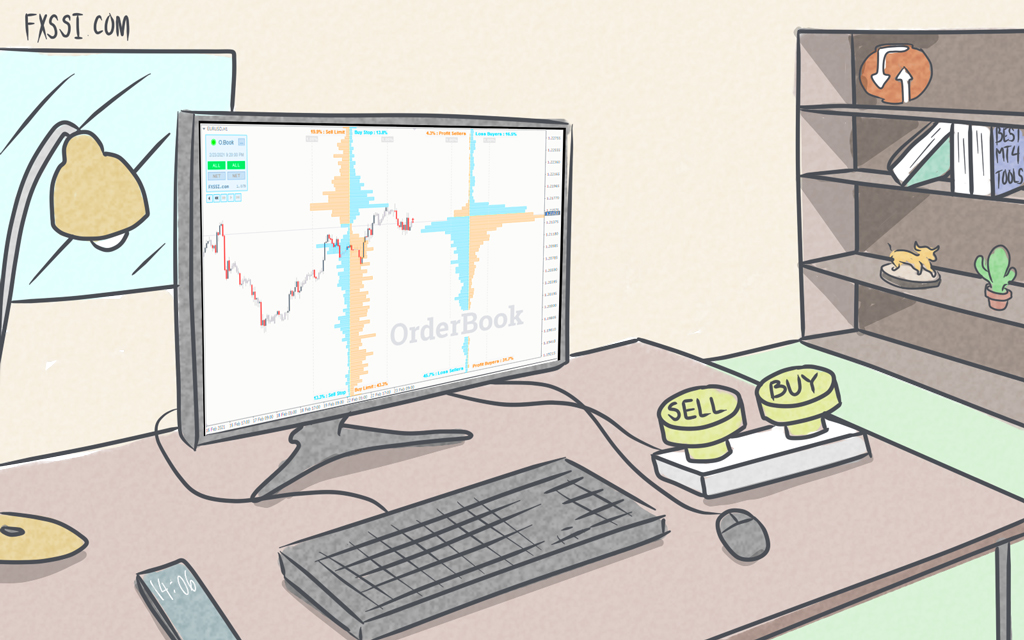
One trading style that relies heavily on pivot points is the intraday or day trading. The reason behind this is that pivot point trading includes strategies that often allow intraday traders to get in and out of trades within a day.

One of the two approaches to trading Forex is fundamental analysis. It relies heavily on measuring the performance of the economies of currencies. And one way to go about this is through the news.

In this article, we’re going to share some useful tips in case you decide to trade the news. Also, as a bonus, there’s a common news pattern example analysis at the end.

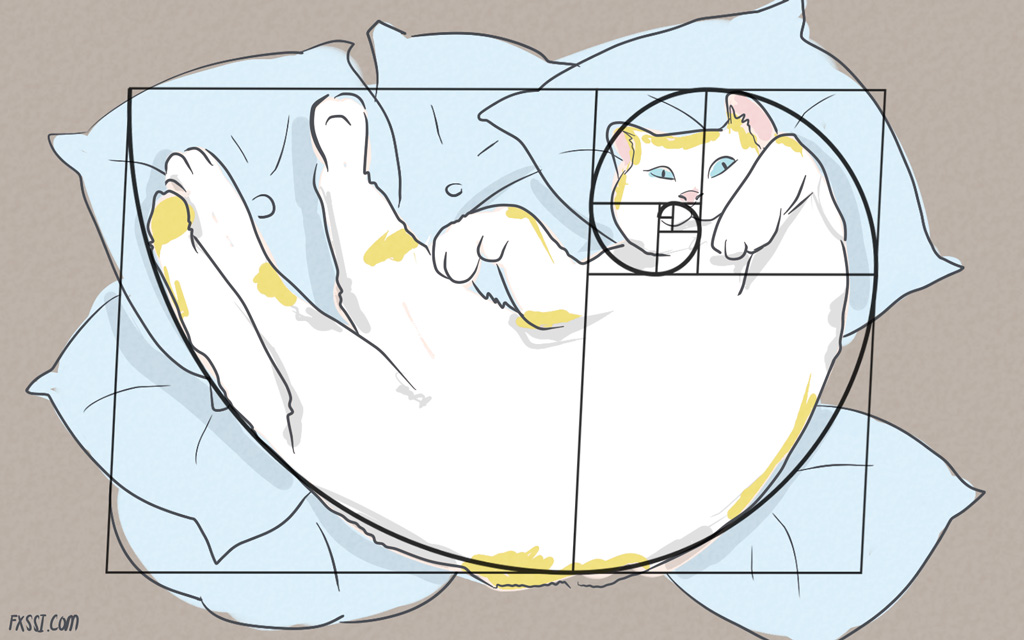
Did you know that the ratio of the length of your forearm to the length of your hand is 1.618? That's the golden ratio. And it's found in the Fibonacci sequence and exists in almost everything if you know where to look, even in Forex.