
How to Make the Best Use of the Stochastic Indicator in Your Forex Trading
Developed in the 1950s by George Lane, the stochastic indicator has grown to be one of the most popular indicators today.
Developed in the 1950s by George Lane, the stochastic indicator has grown to be one of the most popular indicators today.

The trading style you adopt in forex plays a huge role in how frustrated or stressed out you would be on your forex trading journey.
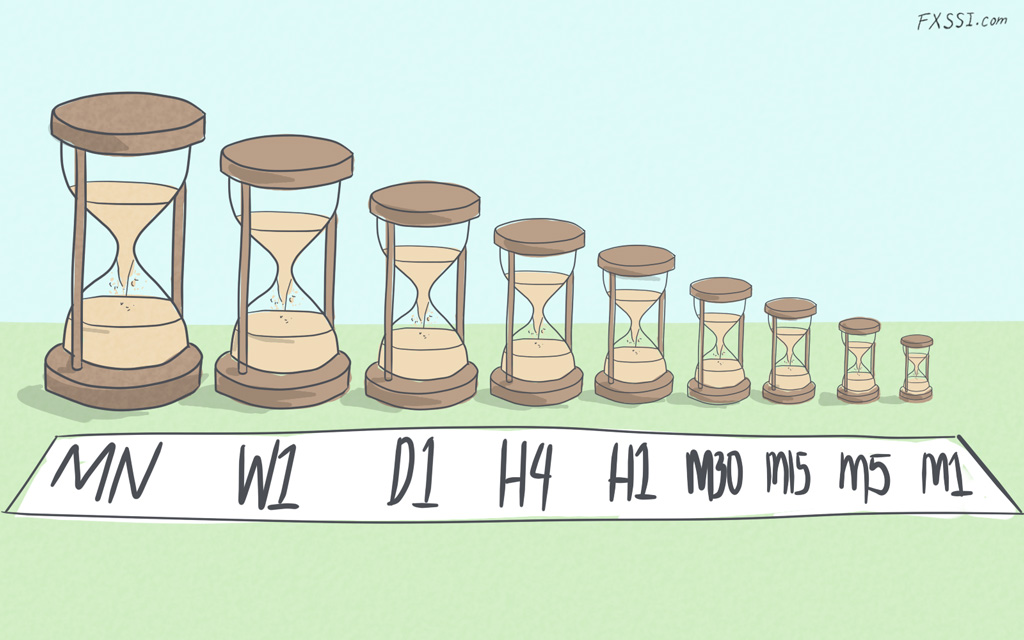
There’s been a lot of buzz about multi timeframe analysis lately, but what exactly is this type of technical analysis and why should you incorporate it into your forex trading strategy?

Have you ever seen the market bounce hard off a key level, but the trend is still overwhelmingly against the bounce?

Have you ever been in a trade where everything seems to be going according to your analysis? You take your eyes off your charts for a moment and return to find that your trade has closed at an unexpected loss.
Forex is an extensive market with an endless list of currency pairs to trade. But some of them take the lead when it comes to trading volume. We call them major currency pairs or FX majors.

Trader psychology is a primarily overlooked ingredient in achieving and maintaining trading success. One of the biggest aspects that poses a challenge to traders is FOMO, a term meaning the fear of missing out.
If you ask any trader what data they take into account before taking a trade, chances are the word "confluence" is going to come up.
For many new traders, the big question then is which to choose between the Forex market vs the stocks market?

Among all available market sentiment indicators SSI is the easiest to understand and, as a result, the most popular. Is it that effective? Let's discuss.